The OneStream Analytic Drill Down solution begins from a Dashboard or Cube View and can be launched from the OneStream application or the Excel Add-in. The user will identify a financial data point they want to analyze further. Upon right-clicking on the data point, the user can navigate to OneStream Analytic Drill Down. The following sections will demonstrate how to access the tool and explain each option available to the user.
Launching OneStream Analytic Drill Down
You can launch OneStream Analytic Drill Down from OnePlace or from a cube view.
Launch from OnePlace (Ad Hoc Analysis Mode)
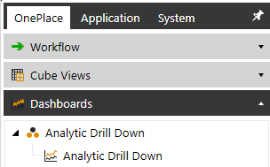
Navigate to OnePlace and select Analytic Drill Down.
Launch from Cube View
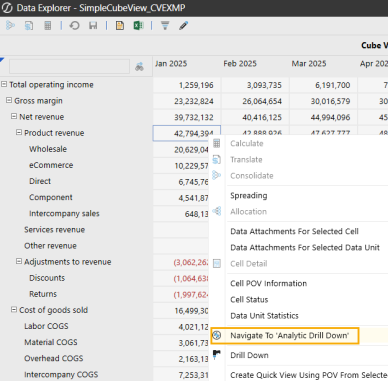
Right-click on the data point of interest from the desired Data Explorer view. From the resulting dialog box, select Navigate to Analytic Drill Down.
Utilizing OneStream Analytic Drill Down
Upon selecting Navigate to Analytic Drill Down, the user will be presented with the following screen. To use the tool, the user selects from the various options, and upon refreshing, the user is presented with a more detailed view of the original data point. The selectors are grouped into Global and Dimension Based options. The following sections will examine and explain each of the available options.
NOTE: Ensure the OneStream Global POV settings are established with appropriate Entity and Time and any other dimensions necessary to return data in the application before attempting to utilize OneStream Analytic Drill Down.
Global Selections
OneStream Analytic Drill Down contains 5 selections that will appear and be available no matter what the drill type used. They are as follows:
 of Drill Options_477x431.png)
-
Drill Type Selection
-
Scaling Options
-
POV Selections
-
Frequently Used POVs
-
Drill to Options
Drill Type Selection
There are 3 drill types: Standard, Variance and Matrix.
 of Drill Types.png)
Standard and Variance drill types utilize up to 7 panels to drill down into any member/dimensions combination desired to drill into POV balances while the matrix drill type can be used to explore a POV while controlling the dimension members in both the rows and columns.
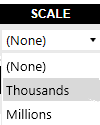
Scaling Options
Users can choose to scale the numerical results. The drop-down option will enable a “None”, “Thousands”, or “Millions” scale to round the number as if it has been divided by that amount. For instance, the amount 853,117 can be displayed as is using “None” for scale. The exact amount scaled to “Thousands” will show as 853.1, and, scaled to “Millions,” will display as 0.9, rounded to the nearest decimal.
POV Selections
The POV option appears on the right by default. The small arrow on the top right can be clicked to hide or unhide the option. The shaded POV buttons are selectable and can be changed.
 of POV_600x243.png)
NOTE: Ensure the OneStream Global POV settings are established with appropriate Entity and Time and any other dimensions needed to return data in the application.
Frequently Used POVs
Frequently Used POVs, or Saved POVs, can be used to change to commonly used points-of-view quickly and easily. They can be added to, or accessed from, OneStream Analytic Drill Down launched directly from a Cube View or from Ad Hoc Analysis. Saved POVs are limited to 10 and are unique to each user.
![]()
Using Saved POVs
Saved POVs can be accessed from the window below the OneStream Analytic Drill Down POV. Select a Saved POV name and the OneStream Analytic Drill Down POV members will be updated accordingly.
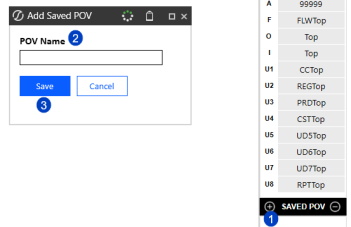
Adding and Removing POVs
POV names are limited to 18 characters and users can have no more than 10 at a time saved. To add a POV, click on the “+” sign (1) from the “Saved POV” window, enter a name (2) and click Save (3).
To remove a saved POV, first click the Saved POV Name (1) from the “Saved POV” window. Wait a moment until the Drill POV is updated with that respective POV’s values, then click the “-“sign (1). Confirm removal by clicking “Remove.”
 of Saved POV_284x97.png)
Drill To Options
The Drill To section has three main sections, the look of which will depend on the solutions settings maintained by the solution administrator.
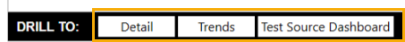
Drill To Detail
Drill to Detail is an optional dashboard that can be enabled by the solution administrator. See Detail Drill Settings to enable and disable this option. If enabled, the button below will be visible from OneStream Analytic Drill Down. Clicking the button will produce a new dashboard as a pop-up that will provide Stage, Journal and Form details behind your current POV.
Grids Layout
From Drill Detail dashboard you can view the following:
-
Summary stage data records (shown initially by default)
-
Detail stage records (when clicked)
-
Current balance Form and Journals including form/journal name, entry users and time stamps
-
Form and Journal audit history
-
Impacting journal details
Data Limitations
There are limitations to the data “Drill to Detail” will display. This is due to two main reasons:
-
OneStream Analytic Drill Down leverages OneStream audit tables, in part or whole, for much of the detailed records. As a result, only activity that is logged will be available.
-
If any of the audit tables get purged, this will also impact the details available to display.
Below are additional limitations to be aware of when using Drill to Detail.
Data that will not appear at all as detail records:
-
Derived data
-
Data that is calculated, modified, or cleared by a business rule
Data that may not appear correctly, depending on the situation:
-
Stage data that is altered after loading to the Import member within the destination cube. This can occur by altering Import cube data via business rules or Data Management jobs. In such cases, there can be a disconnect between the amount drilled down into and the displayed Stage data.
-
The POV view differs from the view to which stage data was loaded. For example, if you drill down into the M13 period for the “Net Income” account, with a view of Periodic, the stage data that appears may be in the YTD format and not agree to the drilled Periodic value.
-
Any detail records that display a user name will show the name as blank if the user is deleted from OneStream after their logged activity. However, disabled users will still have their information shown.
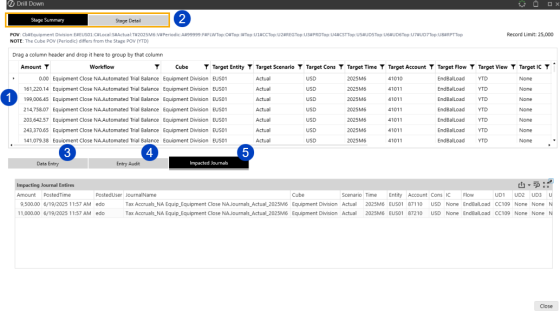
View Source/Target Detail
To view detailed records, including source and target information, that make up the consolidated stage records on the main “Drill to Detail” screen, click the “Stage Detail” tab.
NOTE: Inactive tabs are colored in grey and active tabs in dark blue.
Clicking this button will show detailed records for the main POV with available Source and Target fields. By default, no attributes are shown, however, by selecting the Show Attributes checkbox (1) the grid will refresh and show any attribute columns that contain data. Columns that may be shown if data is populated are: A1 through A20, V1 through V12 and Label.
NOTE: If the default security viewing of source records is in place and not overwritten (see Detail Drill Settings), users will only have access to detailed records for which the user has access to the underlying workflow through which the records were loaded. If this security option is overwritten, the user will have access to view all the detailed records behind a POV to which they have access.
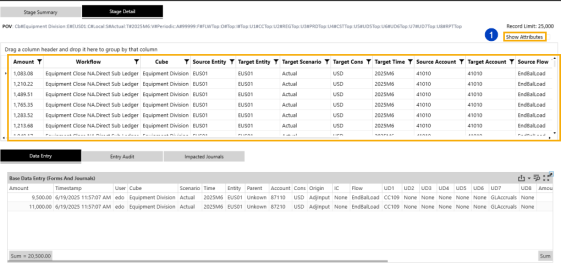
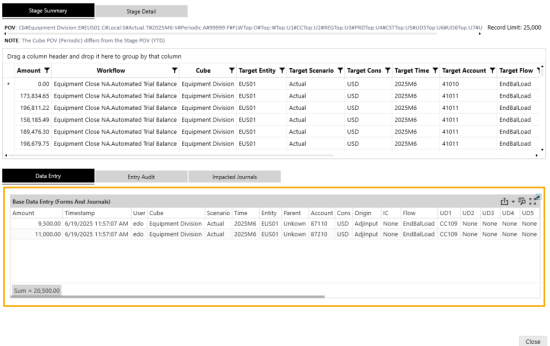
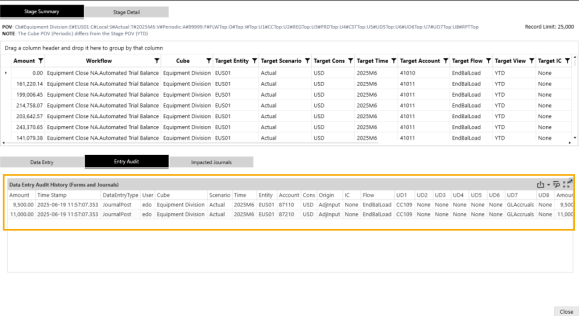
Data Entry
The Data Entry grid displays Form and Journal details supporting the current POV balance.
Entry Audit
The Entry Audit grid is similar to the standard Data Entry Grid but displays not just the current balance records but all available history sorted with the most current listed first.
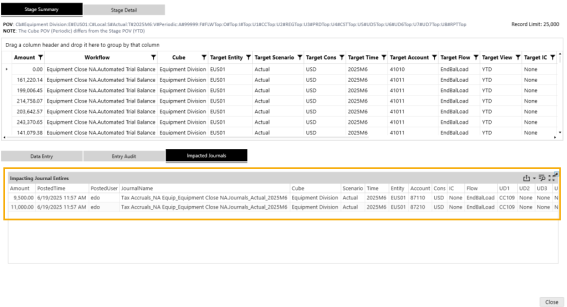
Impacting Journals
The Impacting Journals grid is similar to the standard Data Entry Grid but filtered to display the current Journal records supporting the noted POV.
Drill To Trends
The Drill to Trends provides users the ability to select a OneStream Analytic Drill Down intersection and view various pre-defined time trends for that POV. To utilize this feature first, select an intersection (1) and click the Trends button (2).
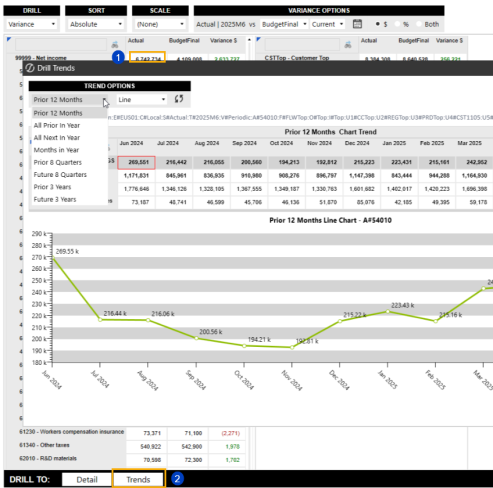
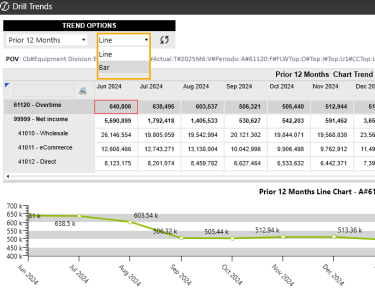
In the dashboard that pops up, a cube view will be displayed with the member selected highlighted in gray (1) across the time series. The time period in the underlying main POV will be bolded (2) to distinguish it from the other time periods shown.
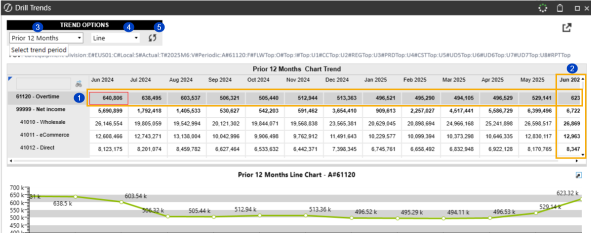
The Trend dashboard has two options to choose from to further analyze you selected POV: Trend Periods (3) and Chart Type (4). After updating either, the refresh button (5) must be clicked to update the cube view and graph.
In addition, when the cube view contains multiple members in the rows, you can select a different row to automatically update the graph to reflect the results for the selected row member.
Trend Periods
There are 8 pre-defined time trends to choose from as shown below. For all options, the main POV time period will also be shown as reference.
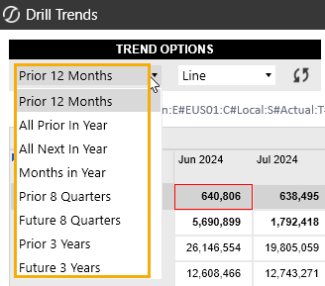
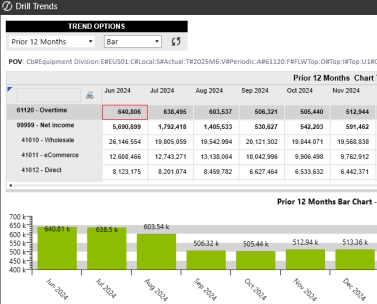
Chart Types
Trends have two graphing options to choose from: Line and Bar.
Drill To Source
To provide additional drill detail, OneStream Analytic Drill Down supports customized connections to source systems created separate from the solution. OneStream Analytic Drill Down provides the ability to pass a POV to a client provided dashboard to view additional detail behind a drill value. An unlimited number of connections can be stored, but only 4 can be active and available for selection at a time in the solution.
Any enabled Drill to Source connection button can be selected from a Standard, Variance or Matrix drill amount. Unless otherwise provided for in the custom connection code, if a user has access to view an amount in OneStream Analytic Drill Down, they will have access to execute any enabled source connection.
Creating A Source Drill Connection
The best way to illustrate how to create a Source Drill Connection is to highlight the provided example connection named “TestSourceConnector” which is disabled by default.
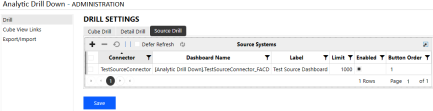
Step 1: Create and enable a connection.
From Drill Settings, select the Source Drill tab and create a connection with the grid ensuring all columns are filled in. Once the data is entered (A), click the disk icon (B) to save the data within the grid.
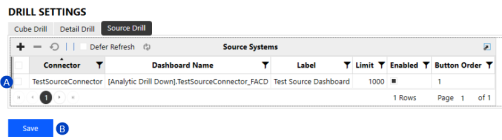
The example above uses a test connector provided as part of the solution installation. The only data changed is the Enabled column and Button Order. Only connections that are enabled will be displayed in OneStream Analytic Drill Down. The Button Order column should only have a value (of 1-4) for enabled connections, which will determine the order the connection buttons are displayed in the solution. Ensure dashboard name is prefaced with the applicable Workspace name in brackets followed by a period, as in the example above.
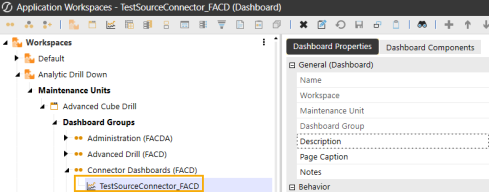
Step 2: Create the dashboard entered in Step 1.
Create a dashboard, if it does not already exist, as named in Step 1 under the Dashboard Name column. It is recommended to create non-test dashboards outside of the Analytic Drill Down Workspace so the dashboard is not deleted upon a solution upgrade. The example below is from the provided test connection.
.Step 3: Consume the OneStream Analytic Drill Down provided POV in the Source Connection Dashboard.
When a OneStream Analytic Drill Down amount is selected, and a Source Connector is clicked, the POV information is saved by OneStream Analytic Drill Down into a user state parameter that can be accessed easily via code by the dashboard defined in the connector settings.
Standard and Variance Drill Types
Both the Standard and Variance drill types allow you to drill down into a POV using multiple panels to obtain deeper levels of detail. However, the Variance drill type can provide context by showing a comparison period with variance details.
Standard Drill
This is the standard ability to drill into the given data point based on desired dimensions. See below for further details on selecting Dimensions.
Variance Drill
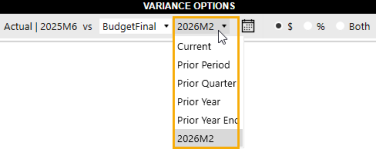
In addition to drilling into a given data point, the Variance Drill option allows the user to compare the result against another scenario or time. For example, the user may desire to compare their data point against actuals from the prior period or budget from the same period. Once the Variance Drill option is selected, a new menu option window will display on the right.
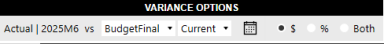
The Variance Drill option enables you to select the comparison scenario and time and the view of the variances in amounts or percentages. The left side of the Comparison menu, Actual | 2022M1 in the example above, is dynamically tied to the user’s original data point of interest. The drop-down menus to the right allow the user to select the desired comparative scenario and time frame. Time frame options include Current, Prior Period, Prior Quarter, and Prior Year.
NOTE: The Administrator controls Scenarios Available for comparison in the OneStream Analytic Drill Down Solution Administration Settings dashboard.
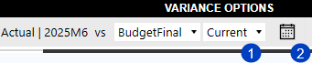
Variance Time Options
There are two ways to select a time period to compare your selected variance scenario to. You can select from a list of predefined dynamic times (1) and are relative to the POV time, or you can select any custom time member from a dialog (2).
Dynamic Time Selections
OneStream Analytic Drill Down provides 5 pre-defined dynamic times to compare to the current POV. All times are relative to the current POV.
Custom Time Selection
In addition to predefined dynamic members, users can select any time period as the basis of comparison by selecting the calendar icon to the right of the dynamic time combo box. Selecting this will launch a dialog where you can select any time and add to the list by clicking OK after selection.
 of Custom time_339x274.png)
Once selected, the time period will be added to the list as shown below and will be available in the list until the user logs out at which time the list will be reset. Multiple times are allowed to be added.
![]()
Variance Sorting
This drop-down menu impacts the order in which the data is presented. Data can be set to either Ascend, Descend, or be based on Absolute values. Using ‘None’ presents the data in the order the members exist in the given dimension hierarchy.
TIP: This selection only applies when the given dimension is set to Base or Children.
![]()
Dimension-Based Selection
This section will focus on selections made based on specific Dimensions of interest. These selections can be updated as desired while utilizing the tool. The solution allows for detailed analysis of up to seven dimensions. The following described options behave identically across all seven panels of the solution.
Drilling Dimension-Based Options
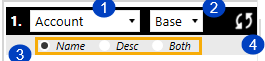
-
Dimension Selector: This drop-down menu allows users to select the dimension they desire to drill down into. Account, Entity, Flow, plus all User-Defined Dimensions, are available.
-
Hierarchy Selector: This drop-down menu allows the user to select the desired member expansion. Base, Tree, Children, and Grand Children are available. As noted above, when selecting Base, the user can change the presentation of the result using the global Sort options to simplify analysis. When selecting Tree, the data is presented based on the given dimension's complete hierarchy.
-
Member Property: These radio button options allow the user to define whether a member’s Name, Description, or both are displayed. This option is not available if the Tree Expansion is selected.
-
Refresh Button: Updates the resulting data set based on the user’s selections.
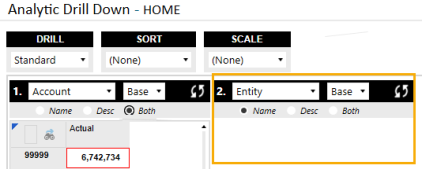
Drilling Into Multiple Dimensions
By default, the user is presented with one dimension from which to select. However, the user can add additional Dimensions to further analyze their data at a lower, more granular level of detail. The second-dimension drill window is displayed automatically after you refresh the first screen. The third will display after the second is refreshed, and so on.
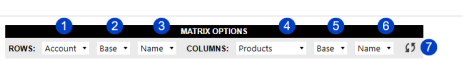
Matrix Drill Type
The Matrix drill type provides users the ability to control (2) in a single panel whatever dimension type and member they would like to see in the rows and columns (1).
 of Matrix options_540x146.png)
Matrix Selections
Matrix options are split between those for Rows and Columns which can be independently controlled. The first option for each, (1) and (4), control the dimension type displayed in the applicable matrix axis. Next, users can select by axis the expansion type they would like displayed (2) and (5), similar to the functionality in Standard and Variance drill types. Lastly, if expansion type Tree is not selected, each axis will have an option for how to display the header information (3) and (6). To update the matrix cube view for selection changes, click the refresh button (7).
Matrix Performance
Note that the matrix drill cube view has the ability to return a large number of records, particularly if a data unit dimension is included in both the row and column so be careful of what selection you make and be prepared to wait if a large number of data units are requested.


