Instead of logging onto the server to collect metrics, use the Monitoring page to access real time Key Performance Indicators (KPIs) across an environment. Click System > Tools > Environment > Monitoring to:
-
Access user activity and interactive KPI graphs.
-
Track all system components that affect stability and performance.
You can perform these tasks:
-
Open: Access a metrics and configuration setting file from the File System or a local folder.
-
Save As: Save metrics and configurations locally or in the File System.
-
Settings: Specify these types of KPI metrics to monitor and the monitor frequency:
-
Environment
-
Application Servers
-
Database Servers
-
Server Sets
-
-
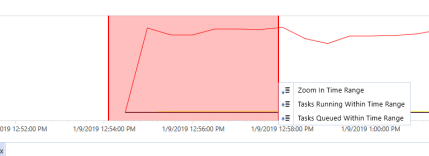
Zoom into part of the chart to see running or queued activities.
-
Refresh Automatically Using a Timer: Retrieve metrics based on the Play Update Frequency interval setting.
Specifying General Settings
-
General Play Update Frequency (seconds): How often to update Performance charts.
-
Metric and Task Time Range: Indicate how much historical data to retrieve and depict on the Performance Chart. Applying a time range can help identify the cause of a server event or issue.
-
Y-Axis: If Auto Range box is selected, the system sets the range for the Min and Max values on the Y-Axis. If cleared, you can set the Min and Max ranges on the Y-Axis.
-
Secondary Y-Axis: Displays series of a different range of values, or different arguments (or values) in the same chart. Can be used when the numbers in a chart vary widely from data series to data series, or when there are mixed types of data.
Specifying Monitoring Settings
-
Monitoring(Server filter): Identify specific application or database servers to evaluate.
-
Filter Type: Specify the type of servers for which to collect metrics.
-
Source Filter: Use to filter the Source List.
-
Source List: Displays the servers that meet your criteria.
-
Result List: Displays selected Source List items for which to collect metrics.
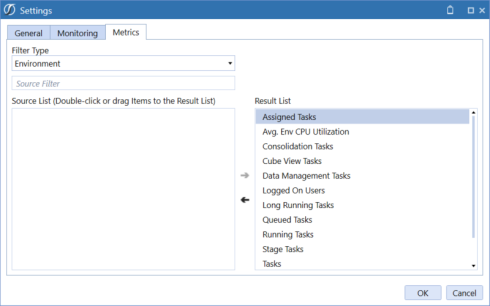
Specifying Metrics Settings
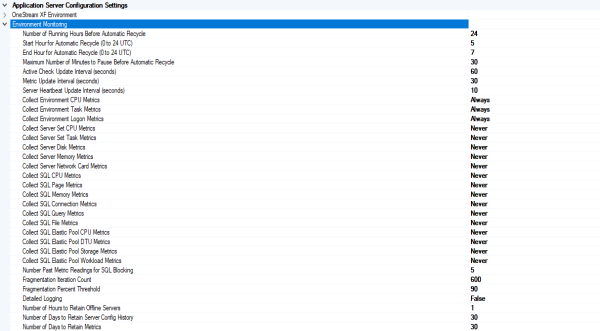
Metrics are collected based on the Metric Update Interval (seconds) setting in the Application Server Configuration utility. To minimize database access and maximize performance, some metrics are collected on every iteration, but some will skip iterations based on count settings defined for a metric.
-
Filter Type: Refine the types of application servers, database servers or server sets for which to collect metrics.
-
Source Filter: Use to filter the Source List.
-
Source List: Displays the list of filtered application servers, database servers or server sets.
-
Result List: Displays the items for which to collect metrics.
These settings shown below in the Application Server Configuration File in Environment Monitoring, determine which metrics are collected and how often.