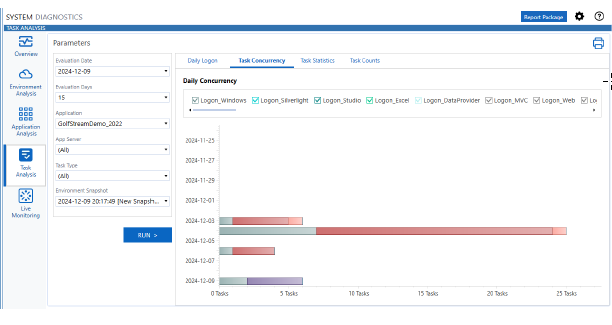
This page lets you query the number of tasks running in parallel over a given time frame by application, application server, task type, and environment snapshot.
Task Concurrency bar chart data is based on the currently selected criteria. Each bar represents a day during the evaluation period. Each color in a bar represents either a task type defined using the evaluation criteria or a selected log-on type.
Like Daily Logon charting, checkboxes at the top of the chart represent the different daily concurrencies being tracked based on the evaluation criteria. Select or clear checkboxes to show or hide log-on types in each bar on the chart.
View Daily Concurrency Details
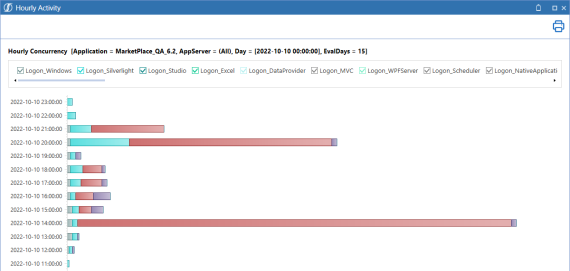
Click on any bar in the Daily Concurrency chart to view the detail for that day in a separate bar chart. The Hourly Activity chart uses a bar to represent each hour increment of the day selected in the Daily Concurrency chart. The left axis labels of the chart are for each two-hour increment in the day.
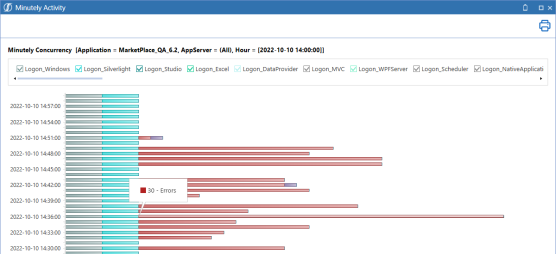
Click on any bar on the Hourly Concurrency chart to view the detail for that hour in a separate bar chart. The Minutely Activity chart uses a bar to represent each minute increment of the hour selected in the Hourly Concurrency chart. The left axis labels of the chart are for each four-minute increment in the hour.
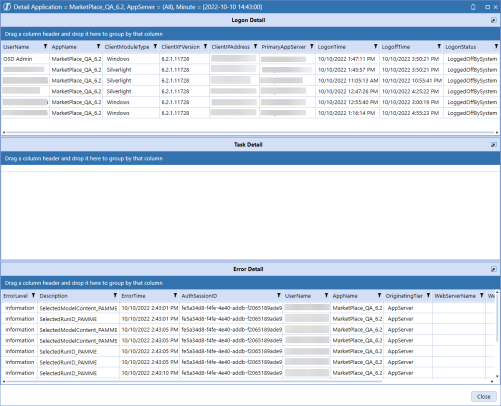
Click on any bar on the Minutely Concurrency chart to view specific log-on detail along with any task or error detail for that minute in a separate detail application window.