Customize the layout of a report at runtime with drag-and-drop operations and conditional formatting based on analysis requirements. Pivot Grids summarize data and display calculated text and decimal fields in a cross-tabluar format which you can sort, group, and filter. The Pivot Grid also supports drill down to view the underlying Data Adapter results table. You can print or export the resulting output to various file formats such as PDF, XLS and XLSX.
Saving Preferences
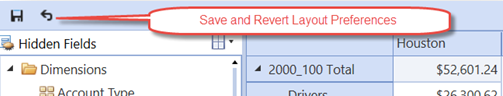
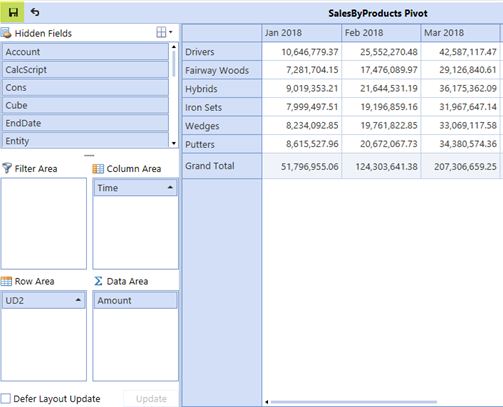
You can change the layout of a Pivot Grid from the defined default. Click the Save button to retain the modified layout as a user preference, and click the Reset button to revert any saved preferences to the component’s default.
Layout Controls
Modify the user interface displaying layout components, such as field and location order.
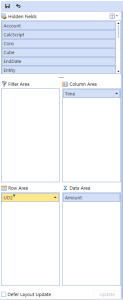
The Pivot Grid provides areas where the data source fields, such as dimensions and measures, are located:
-
Hidden Fields
-
Filter Area
-
Row Area
-
Column Area
-
Data Area
Change the location or order of the fields with drag-and-drop operations.
Hidden Fields
This area contains fields, enabling you to apply filtering to the entire Pivot Grid.
Filter Area
This area contains filter fields, enabling you to apply filtering to the entire Pivot Grid.
Row Area
This area contains row fields. The values of these fields, listed along the left edge of the grid, represent row headers.
Column Area
This area contains column fields. The values of these fields, listed along the top edge of the grid, represent column headers.
Data Area
This area contains data fields that summaries are calculated against. Summary results display in the data area.
Moving a Field to the Pivot Grid
Move a field to a specific area by dragging its header to the appropriate form area box.
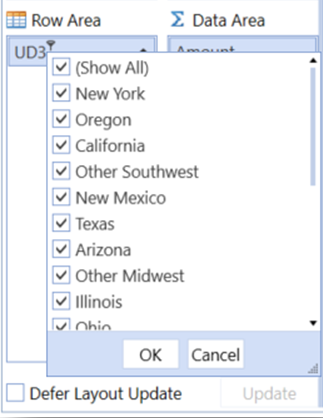
Sort and filter data
Toggle the sort order of fields by clicking their headers in the form area boxes to display the filter pop-up window.
Defer Layout Update
Select theDefer Layout Update checkbox to delay layout updates. Drag fields between areas and click the update button to apply changes.
Pivot Grid Settings
The Pivot Grid settings enable you to:
-
Add global filters using show prefilter.
-
Activate totals for groupings and aggregations.
-
Provide exports for file outputs.
Save and Restore
You can modify the layout of the Pivot Grid at runtime. The Save icon retains changes and the Restore icon returns component properties to default settings. The Save State setting on the Pivot Grid component properties enables the Save icon on the pivot grid when set to True and removes the Save icon when set to False.
When copying a dashboard containing a Pivot Grid, the Pivot Grid layouts are saved per dashboard location, not by component. Each time a dashboard is run, the Pivot Grids should have different saved layouts.
Pivot Grid Save State Property
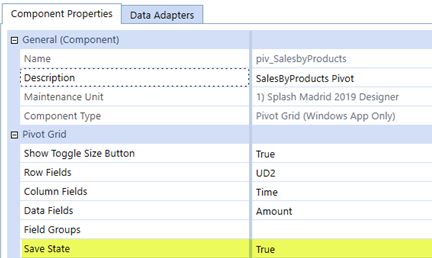
Setting the Save State to True enables the Save icon, enabling you to save layout changes. Otherwise, the layout will revert to original settings.
Context Menu Options
You can modify the Pivot Grid component for additional user preferences by right-clicking the property box in the upper left of the grid. Several context menus in the Pivot Grid provide options to modify layout.
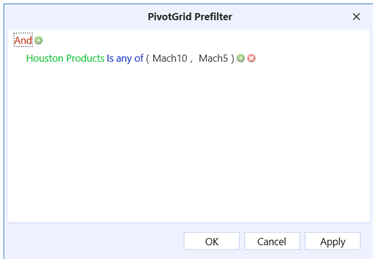
Show Prefilter
The prefilter enables modification of records returned to the Pivot Grid. Consider any existing filters defined as a default in the component properties. For example, the Filter Area may assign dimensions with initial filtering defined. The benefit of a prefilter is that the setting is not specific to a dimension filter assigned to the row, column, hidden, or filter areas. This enables the dimensions to pivot between field and layout areas, while permanently maintaining the filter. The Prefilter dialog box applies filters by defining the dimension, operator, and object.
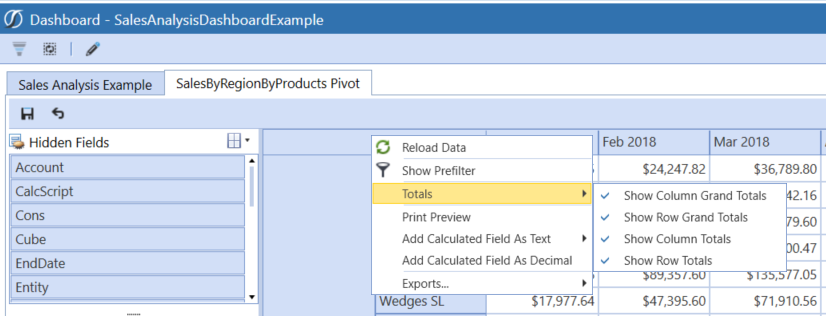
Totals (Show/Hide)
Showing or hiding totals creates automatic totals for row and column grand totals. They display summary totals calculated against all the rows and columns and row and column totals which display sub-totals calculated for outer row and column fields.
-
Show Column Grand Totals creates automatic totals for column grand totals, displaying summary totals calculated against all columns.
-
Show Row Grand Totals creates automatic totals for row grand totals, displaying summary totals calculated against all rows.
-
Show Column Totals displays column totals that show sub-totals calculated for outer column fields.
-
Show Row Totals displays row totals that show sub-totals calculated for outer row fields.
Add Calculated Field as Text
-
Adding on the column enables you to include additional fields in the column or groupings based on the data source.
-
Adding on the row enables you to include additional fields in the row or groupings based on the data source.
Both options enable you to right-click the additional calculated field to open the Expression Editor Capabilities. This enables you to create and modify expressions. The Expression Editor supports numerous standard functions and operators that enable performance of different string, date-time, logical, and math operations over data.
Add Calculated Field as Decimal
This option enables the inclusion of additional fields as data to the Data Area and groupings based on the data source. This enables you to right-click on the new calculated field to open the Expression Editor, which enables the creation and modification of expressions. The Expression Editor supports numerous standard functions and operators that enable performance of different string, date-time, logical, and math operations over data.
Exports
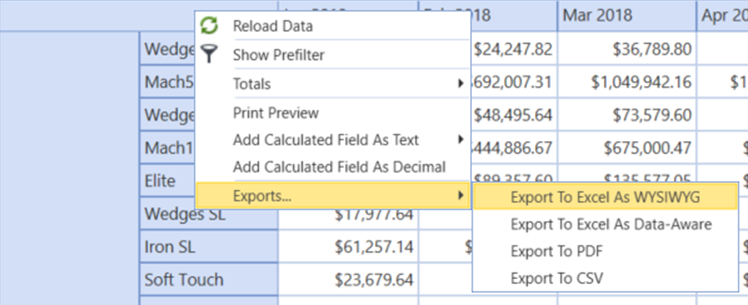
Export options include:
-
Export To Excel As WYSIWYG. Excel WYSIWYG provides a static presentation of the current Pivot Grid.
-
Export To Excel as Data-Aware. Excel Data Aware provides an Excel file with Pivot definitions converted to interactive Excel functions, such as Groupings.
-
Data Grouping: Collapse or expand groups within a worksheet.
-
Fixed Headers: Column and row areas stay in sight.
-
Cells Formatting: Retains the number format.
-
Display Text/Value export: Select whether to export display text or values.
-
-
Export To PDF exports the Pivot Grid to the specified file path in PDF format. PDF exports to a PDF printable file.
-
Export To CSV exports the Pivot Grid to the specified file path in CSV format. CSV separates all dimension fields into CSV formatted fields.
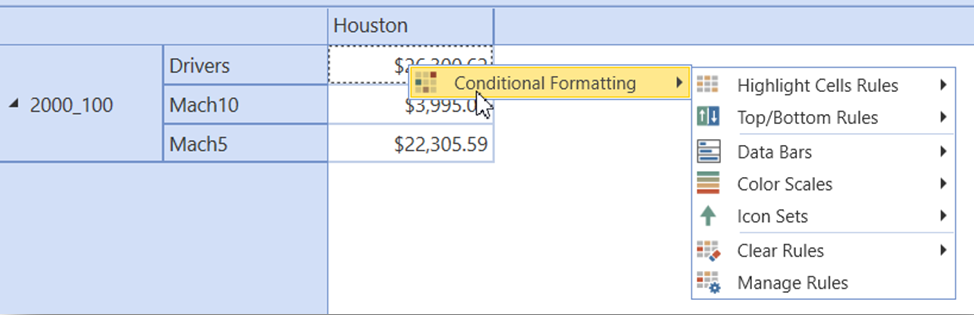
Pivot Grid Component Conditional Formatting
The Pivot Grid component supports the application of conditional formatting to the data cells, which provides a graphical context to the data. Formatting options range from coloring and shading to indicator icon sets. Use the Manage Rules context menu option to customize conditional formatting. You can display conditional formatting by right-clicking a cell in the Pivot Grid.
Expression Editor Capabilities
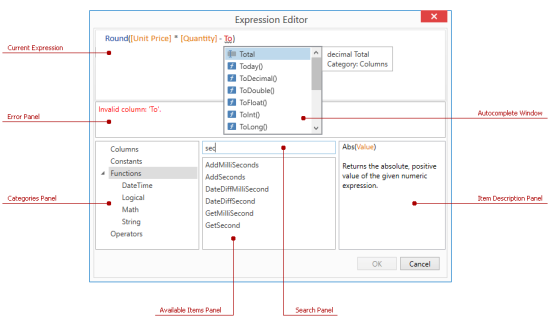
Current Expression
The Expression Editor contains a text box that enables changes to expressions. The Expression Editor helps edit your expressions with syntax highlighting and intelligent code completion, which suggests functions as you type.
NOTE: When editing expressions in the Expression Editor, columns and fields are referred to by display names enclosed in square brackets.
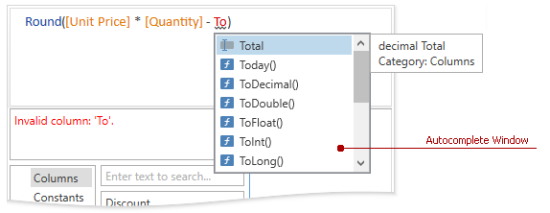
Autocomplete Window
The autocomplete window displays when editing an expression. This pop-up window lists available operators, functions, and columns. Press Ctrl+Space to displaythis window.
Selecting an item in the autocomplete window displays a tooltip with information about the selected item.
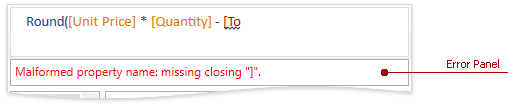
Error Panel
If an expression contains any errors, the editor highlights them in place and presents them in the error panel.
Categories Panel
This panel lists available items divided into columns, constants, functions, and operators groups.
Available Items Panel
This panel lists items in the selected category.
Search Panel
This panel enables you to search for items in the selected category.
Item Description Panel
This panel shows a description of the item selected in the available items panel.
Changing the Name of a Calculated Field
-
Right-click a calculated field and click Rename Calculated Field.
-
Enter the new name and click the OK button.
Data Adapters Command Type Details
Cube View
Choose a cube view as the source of the data adapter. Additional options are available to include supplemental information for the resulting tables. However, adding to the default may have a slight impact on performance.
Cube View
This command type allows for a pre-configured cube view to be the data source for a dashboard. Click  and begin typing the name of the cube view in the blank field. Names are filtered while you type, making it easier to find the target cube view. If the name is unknown, expand a cube view group and scroll through the list to select the correct one. Once the cube view is selected, press CTRL and double click. This will enter the correct name into the appropriate field.
Data Table Per Cube View Row
This option is set to True by default. When set to True, a data table is created for each row in the dashboard. This allows for conditional formatting per cube view row. Setting to False merges the rows into one table. This will omit any undefined cube view row.
Include Title
This option is set to False by default. When set to True, the title displays from the report section of the cube view as the title of the dashboard.
Include Header Left Label 1-4
This option is set to False by default. When set to True, the left header labels display in the report section of the cube view for the dashboard.
Include Header Center Label 1-4
This option is set to False by default. When set to True, the center header labels display in the report section of the cube view for the dashboard.
Include Header Right Label 1-4
This option is set to False by default. When set to True, the right header labels display in the report section of the cube view for the dashboard.
Include… POV
If this option is set to True, the POV information for the cube, entity and all other dimensions are included. Use these if the report or dashboard needs this information.
Include Member Details
If this option is set to True, results return additional member property details.
Include Row Navigation Link
If this option is set to True, this data adapter will include a row navigation link from a cube view.
Include HasData Status
This option Includes additional true/false data on whether the row of results contains data for filtering purposes.
Include … View Member Text
This option determines whether results include different data attachment text. This is necessary for displaying text in a data explorer object or for optionally displaying comments in a waterfall chart.
Results Table Name
This specifies the name of the resulting table generated when the data adapter is run. Left unmodified, it will default to the name Table.
Cube View MD
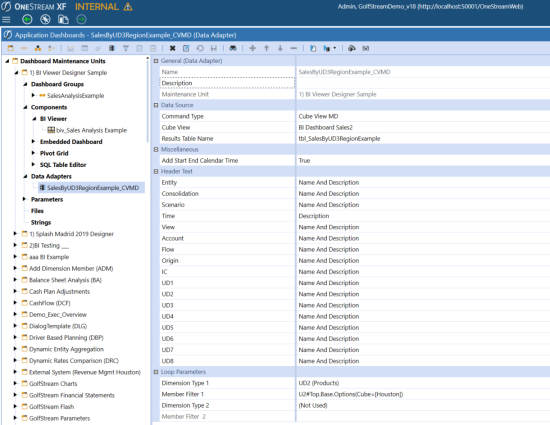
Choose a cube view multi-dimensional, or cube view MD, as the source of a data adapter. This command type will return the selected cube view as a multi-dimensional fact table versus the reporting table that is returned by the cube view command type. The results of the cube view MD are dimensions (entity, consolidation, scenario, time, view, account, flow, origin, IC, UD1-UD8) as columns. This simplifies the report building process in the BI Designer, Pivot Grid, and Dashboard development. There are additional loop parameter options here to include incremental information from the modified cube view definition in the resulting tables. Adding to the default may have a slight impact on performance.
The cube view MD data adapter is pictured below.
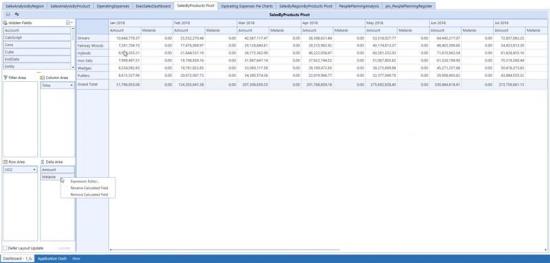
The results table from the cube view MD data adapter is pictured below.
Cube View
This command type allows for a pre-configured cube view to be the data source for a dashboard. Click and begin typing the name of the cube view in the blank field. Names are filtered while you type, making it easier to find the cube view. If the name is unknown, expand a cube view group and scroll through the list to select the correct one. Once you select the cube view , press CTRL and double click. This will enter the correct name into the appropriate field.
Results Table Name
This specifies the name of the resulting table generated when the data adapter is run. Left unmodified, it will default to the name Table.
NOTE: Defining a name here is highly recommend to distinguish between different data adapters if there are many assigned when using the BI Designer. For example, tbl_OperatingExpenses can identify the Results Table Name and the Name of the Data Adapter (OperatingExpenses_CVMD in this example) associated with this table.
Add Start End Calendar Time
When set to True, the data table incorporates the start and end date used in the POV / time profile for the cube view and creates two additional columns in a date/time field type format: StartDate and EndDate for each row in the dashboard. This allows for the ability to utilize the date grouping functions in the BI Designer. Set this to False to not add or display these date and time fields.
Entity
The Name And Description option is set by default. This displays the name and description of the entity. When set to Name, the entity name displays in cube view results table. When set to Description, the entity description displays in the cube view results table.
Consolidation
The Name And Description option is set by default. This displays the name and description of the consolidation. When set to Name, the consolidation name displays in cube view results table. When set to Description, the consolidation description displays in the cube view results table.
Scenario
The Name And Description option is set by default. This displays the name and description of the scenario. When set to Name, the scenario name displays in cube view results table. When set to Description, the scenario description displays in the cube view results table.
Time
The Name And Description option is set by default. This displays the name and description of the time. When set to Name, the time name displays in cube view results table. When set to Description, the time description displays in the cube view results table.
View
The Name And Description option is set by default. This displays the name and description of the view. When set to Name, the view name displays in cube view results table. When set to Description, the view description displays in the cube view results table.
Account
The Name And Description option is set by default. This displays the name and description of the account. When set to Name, the account name displays in cube view results table. When set to Description, the account description displays in the cube view results table.
Flow
The Name And Description option is set by default. This displays the name and description of the flow. When set to Name, the flow name displays in cube view results table. When set to Description, the flow description displays in the cube view results table.
Origin
The Name And Description option is set by default. This displays the name and description of the origin. When set to Name, the origin name displays in cube view results table. When set to Description, the origin description displays in the cube view results table.
IC
The Name And Description option is set by default. This displays the name and description of the IC. When set to Name, the IC name displays in cube view results table. When set to Description, the IC description displays in the cube view results table.
UD1-UD8
The Name And Description option is set by default. This displays the names and descriptions of the UD1-UD8 dimensions. When set to Name, the UD1-UD8 dimension names display in cube view results table. When set to Description, the UD1-UD8 dimension descriptions display in the cube view results table.
Loop Parameters
This section allows changes to the cube view definition output used in a table for reporting. The loop parameter filters results and considers additional parameters to pass to the cube view definition, adding those results to the table accordingly. These parameters override the POV.
Example: If the Entity POV is set to CT, and the loop filter parameters are set to NY, MA, and NJ, then data for those will be returned, not CT.
A loop is required to change parameters. For example, a loop parameter loops through a list of entities in the cube view definition and return multiple entities for that specific cube view. Add dimension type and member filters here to pass along the appropriate loop which applies to each entity included in the loop.
Example: Dimension Type=Entity, Member Filter= E#US.Base
NOTE: It is not recommended to loop on any dimensions that already exist in the cube view’s rows or columns.
Dimension Type and Member Filter
At data adapter creation, the default for dimension type 1 and 2 is set to Not Used and member filters 1 and 2 are greyed out. This will display results without consideration of additional parameters to pass to the query. When the dimension types are set along with member filters, the results will consider the additional parameters to pass to the cube view definition and add those results to the table accordingly. Dimension types 1 and 2 contain the list of members, such as the entity or account. Member filters 1 and 2 contain the list of members, and determine what is seen in the parameter. Start typing in the blank field or click the ellipsis button  to launch the member script builder and enter a member script to change the cube view definition. The example below is changing the POV for the Products and Account.
Example: UD2; U2#Top.Base
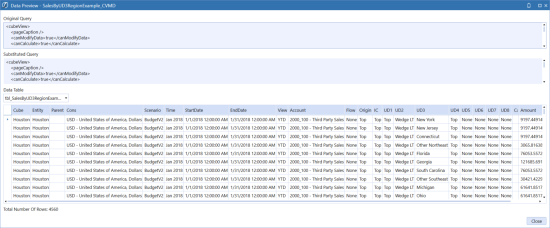
Method Query
To get a method query format example, leave the Method Query field blank, click Save,and then click the Test Data Adapter icon  . The correct way to create the Method Query will display with an example.
Method Query Types
BuisnessRule: Use the BusinessRule option when creating a custom rule to incorporate within a method query. BusinessRule is used as the first set of {} within the method query.
Example: {XFR_DataUnitCompare}{DataUnitComparisonDataSet}
{Cube1=|!Members_Cubes!|, Entity1=|!Members_Entities_AllDims_Base!|, Parent1=[], Cons1=|!Members_Cons_Statutory!|,
Scenario1=|!Members_Scenarios_AllDims_Base!|, Time1=|!Members_Time_WFYear_Base!|, Cube2=|!Members_Cubes!|, Entity2=|!Members_Entities_AllDims_Base!|, Parent2=[], Cons2=|!Members_Cons_Statutory!|, Scenario2=|!Members_Scenarios_AllDims_Base_Var!|, Time2=|!Members_Time_WFYear_Base!|, View=|!Members_View_Numeric!|, SuppressMatches=|!DataUnit_SuppressMatches!|}
CertificationforWorkflowUnit: This lists all certification questions for a particular workflow unit.
Example: {Workflow Profile Name}{Scenario Name}{Time Name}{Include Descendants}{} or {Dallas}{Actual}{2011M2}{true}{}.
ConfirmationforWorkflowUnit: This lists the confirmation rules results for a particular workflow unit.
Example: {Workflow Profile Name}{Scenario Name}{Time Name}{Include Descendants}{Filter} or {Montreal}{Actual}{2011M6}{true}{}Name}{Include Descendants}{Filter} or {Montreal}{Actual}{2011M6}{true}{}
DataUnit: This returns all rows of data related to the specified Data Unit such as cube, entity, parent, consolidation member, scenario, time, and view.
Example: {Cube}{Entity}{Parent}{Cons}{Scenario}{Time}{View} {True}{Empty String or Filter Expression}
DataUnitComparison: This returns all rows from two different data units specified for comparison purposes.
Example: {Cube1}{Entity1}{Parent1}{Cons1}{Scenario1}{Time1}
{Cube2}{Entity2}{Parent2}{Cons2}{Scenario2}{Time2}{View}{True}{True}{Empty String or Filter Expression}
FormsStatusForWorkflowUnit: This lists detailed information about the forms for a particular workflow unit.
Example: {Workflow Profile Name}{Scenario Name}{Time Name}{Form Status}{Filter} or {Houston}{Actual}{2011M1}{All}{}
Groups: This returns the group ID, name, description and whether it is an exclusion group
Example: {GroupName = 'FinanceGroup'}
GroupsforUsers: Select user properties and all of the Groups to which he/she belongs.This returns the same group properties as the Groups method query.
Example: {UserName = 'Administrator'}{}
ICMatchingforWorkflowUnit: This returns a detailed intercompany matching report table for the workflow unit and several other parameters. The parameters here override what is already set up in the workflow profile.
Example: {Workflow Profile Name}{Scenario Name}{Time Name}{Plug Account Override}{Suppress Matches Override}{Tolerance Override}{Filter} or {Flint}{Actual}{2011M1}{Empty String or A#MyPlugAccount}{Empty String or true/false}{Empty String or 0.0}{Empty String or Filter Expression}.
ICMatchingPlugAccountsforWorkflowUnit: This returns the list of intercompany plug accounts for a workflow profile and scenario type configured for the workflow profile.
Example: {MyWorkflowProfileName}{Actual}{2011M1}
{PlugAccount for Workflow Parameter Set (Exclude A#)}{Empty String
or C#MyCurrencyOverride}{Empty String or V#MyViewOverride}{Empty String or A#MyPlugAccountOverride}{Empty String or true/false}{Empty String or 0.0}{Empty String or E#MyEntityOverride}{Empty String or E#MyPartnerOverride}{Empty String or MyDetailDimsOverride (F#All:O#Top:U1#All:U2#All:U3#All:U4#All:U5#All:U6#All:U7#All:U8#All)}{Empty String or Filter Expression}
JournalforWorkflowUnit: This lists the Journals entered for a workflow unit.
Example: {Workflow Profile Name}{Scenario Name}{Time Name}{Journal Status}{Filter} or {Frankfurt}{Actual}{2011M3}{All}{}
Members: This returns dimension ID, member information such as ID, name and description, and other properties for the chosen dimension and member filter.
Example: {Account}{MyAccountDim}{A#Root.TreeDescendants}
{Empty String or Filter Expression}
UserCubeSliceRights: This lists each user’s data access settings on a cube.
Example: {UserName}{CubeName}{Filter} or {AllUsers}{AllCubes}{}.
UserEntityRights: This returns the cubes and entities you have access to according to the security settings under entities.
Example: {UserName}{CubeName}{Filter} or {US Clubs Controller}{AllCubes}{}.
Users: This returns all properties associated for the chosen user name.
Example: {UserName = 'Administrator'}
UserScenarioRights: This returns all accessible scenarios and many related scenario properties for the chosen user name filter and cube.
Example: : {AllUsers}{AllCubes}{Empty String or Filter Expression}
UserinGroups: This returns a list of users and selected user properties for the chosen user group.
Example: {GroupName = 'FinanceGroup'}{}
UserWorkflowProfileRights: This lists the rights assigned to users for workflow profiles.
Example: {User Name}{Workflow Cube Name}{Workflow Profile Type}{Filter} or {Administrator}{GolfStream}{AllProfiles}{}.
WorkflowandEntityStatus: This returns properties for workflow status, status code/description, last run step, date/time information, completed steps, and data status for the chosen workflow unit, including the workflow profile level and individual entity level.
Example: {MyWorkflowProfileName}{Actual}{2011M1}
{AllProfiles}{Descendants}{Empty String or Filter Expression}
WorkflowCalculationEntities: This lists the entities that appear under calculation definitions for this workflow profile.
WorkflowConfirmationEntites: This lists the entities that appear under calculation definitions with a confirmed check box for this Workflow Profile.
WorkflowProfileandDescendantEntities: This creates a list of entities and all descendants located under entity assignment for this workflow profile.
WorkflowProfileEntities: This creates a list of entities located under entity assignment for this workflow profile.
WorkflowProfileRelatives: This lists related workflow profiles based on certain criteria.
Example: {Workflow Profile Name}{Scenario Name}{Time Name}{Workflow Profile Type}{Relative Type}{Include Requesting Profile}{Filter} or {GolfStream}{Actual}{2011M1}{AllProfiles}{Descendants}{true}{}.
WorkflowProfiles: This lists the workflow profiles.
Example: {WorkflowProfileType}{Filter} or {AllProfiles}{Type = 'InputAdjChild'}.
WorkflowStatus: This lists the status, lock status, and last step completed of a workflow unit.
Example: {Workflow Profile Name}{Scenario Name}{Time Name}{Workflow Profile Type}{Relative Type}{Filter} or {Houston}{Actual}{2011M1}{AllProfiles}{Descendants}{}
WorkflowStatusTwelvePeriod: This returns status value and text summary for 12 months for a workflow profile, scenario and year. For workflow profile type, options are: AllProfiles, CubeRoot, Default, Review, BaseInput, InputImportChild, InputFormsChild, InputAdjChild and ParentInput.
Example: {MyWorkflowProfileName}{Actual}{2011}{AllProfiles}
{Descendants}{Empty String or Filter Expression}
Method Query:The query ran for this data adapter.
Results Table Name: This specifies the name of the resulting table generated when the data adapter is run, otherwise it defaults to the name Table.
Method Query Parameter Options
Workflow Profile Type: AllProfiles, AllProfilesExceptInputChild, AllProfilesWithTemplates, AllTemplates, BaseAndParentInputProfile, BaseInput, ClassStandardProfiles, ClassTemplateProfiles, CubeRoot, Default, InputAdjChild, InputChildren, InputFormsChild, InputImportChild, NonInputParentProfiles, ParentInput and Review.
Workflow Profile Relative Type: Ancestors, Descendants, FirstLevelChildren, Siblings and Unrelated.
Workflow Status or Forms Status: Completed, HasError, InProcess, NoStatus, NotExecuted and Unknown.
Journal Status: Approved, Posted, Rejected, Submitted
SQL
You can write a SQL query against either the application or framework database as a Data Source. Reference substitution variables such as |WFProfile| from within the SQL statement.
Database Location
Application: The current OneStream Application database where Stage and financial Cube data resides.
Framework: The connected OneStream Framework database where security and log data resides.
External: Any other database outside of OneStream.
External Database Connection: If the chosen database location is external, select the External Database Connection name here. This list is defined in the OneStream Server Configuration Utility.
SQL Query: The SQL statement ran for this data adapter.
Results Table List: This specifies the name of the resulting table generated when the data adapter is run, otherwise it defaults to the name Table.


