Quantifying Model Accuracy
Error Metrics
Error metrics evaluate a model's accuracy and quantify how far off predictions are from actuals. All error metrics typically work with two inputs: actual data and associated model predictions that line up against those actuals. An arbitrary error metric output is a single number that can be compared relative to predictions made on the same data.
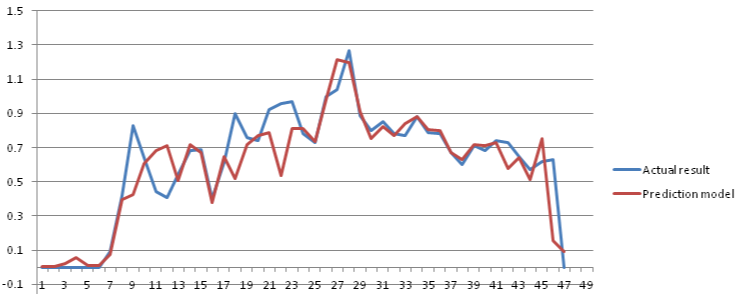
The following graphic shows an arbitrary set of actuals and predictions:
All error metrics work by quantifying the difference between a set of predictions and actuals. The further away a prediction from its associated actual, the higher the respective error is for that given data point pair.
Variations in quantifying this difference between actuals and predictions produce several different types of error metrics.
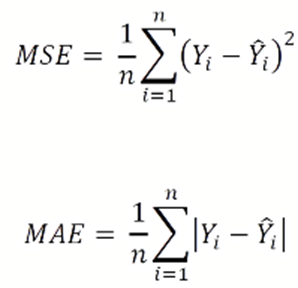
For example, Mean Squared Error (MSE) works by squaring the absolute difference between each actual-prediction pair while Mean Absolute Error (MAE) takes the absolute difference between each actual-prediction pair.
A smaller number for most error metrics is better than a higher number (minimizing error). However, there are certain error metrics such as R2 Score that look to maximize its value to 1. R2 Score is the variance proportion in the dependent variable that can be predicted from independent variables and is closely related to Mean Square Error (MSE).
Evaluation Metrics
An evaluation metric is the error metric that evaluates model accuracy.
You can specify the evaluation metric on the Modeling Configuration page of the Model Build section. You can select the evaluation metric or let SensibleAI Forecast set the evaluation metric to what it thinks is the best metric to use for the modeling task.
The selected evaluation metric is used to:
-
Choose the best model parameters for a model on a target.
-
Compare accuracy across models for a target.
-
Select the best performing model for a target in training that is then put into production.
-
Compare statistical or machine learning models to baseline models.
-
Calculate the health scores. The health score is a mathematical equation that quantifies how evaluation metric changes over time.
Comparisons to Baseline Models
SensibleAI Forecast compares statistical or machine learning models to baseline models to quantify the benefit of using SensibleAI Forecast versus traditional forecasting methodologies. This comparison provides an understanding of the benefit of using intelligent models over more traditional forecasting methodologies.
SensibleAI Forecast creates these comparisons by comparing the evaluation metric of an intelligent model and the evaluation metric of a baseline model. The Pipeline Deploy page of the Model Build section shows the comparison between baselines and machine learning models in different ways. This provides a quality assurance check that intelligent models can learn more than traditional baseline forecasting methodologies for this forecasting problem.
When Baseline Models Outperform Machine Learning Models
You may experience a situation where baseline models, like shift and mean models, outperform their machine learning counterparts because:
-
There is not enough meaningful training data that the machine learning models can learn. Providing machine learning models with more features and data instances to learn from (seasonal, event, weather) typically leads to improved predictive capability. If the time on a machine learning model is trained is too short, the model could perform poorly. If making the training time frame longer is not possible, consider adding additional features and events that could help capture some important data relationships.
-
The level of target dimension aggregation selected within the data may not be ideal. Depending on the data set, sparse data can originate from creating too deep, or specific, a target dimension. Typically, it is difficult for machine learning or statistical models to learn anything meaningful from a highly sparse target (many values are 0).
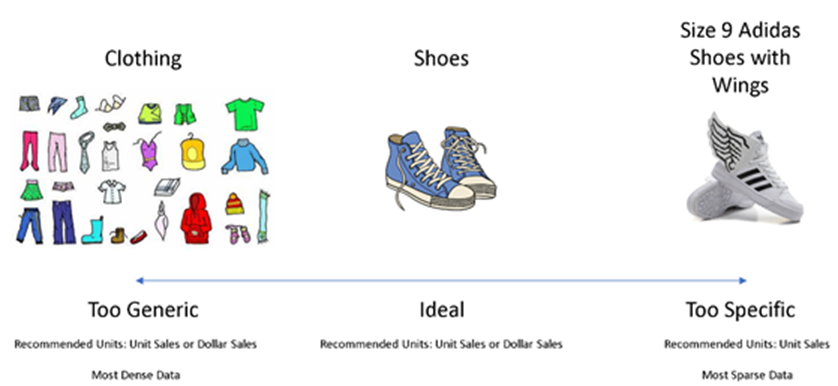
Rolling up to a high-level, or generic, target dimension could hide underlying trends and insights. In the case of a generic target dimension, it is best to use dollar sales over unit sales to ensure that quantified products and services sold are weighted by their dollar amount. This can make it easier for the models to understand value. Intuitively, this makes sense when you consider a situation where the selected target dimension and value are too generic, such as unit sales of clothing.
In this scenario, unit sales could be dominated by high-quantity products with low-value sales compared to low-quantity products with high-value dollar amounts (for example, socks versus Cashmere sweaters). Given unit sales with an overly generic target dimension, a model will struggle to learn seasonality and trend. Keep in mind that this case will align more closely to a sales planning use case than a supply chain use case.
The following provides a conceptual example of target dimension aggregation level. This is not the same across all data sets. Methods for target dimension aggregation should always be assessed to ensure optimized machine learning model learning capabilities.
NOTE: OneStream recommends that you create small project experiments to test varying levels of target dimension aggregation, different amounts of date instances, and different events and features on a small subset of the entire data set. This allows you to determine the best data set format for your project. Do this experimentation until you have Statistical and Machine Learning Models winning consistently over baselines for the most important 60-80% of targets.
XperiFlow Health Score
The XperiFlow Health Score indicates how a deployed model's performance changes over time. The health score range is between -1 and 1. A health score value of zero means that the model performance has remained constant while the model has been in production. A negative health score implies that the model performance has degraded while the model has been in production. A positive health score implies that the model performance has improved since it has been deployed.
The health score is a calculated, weighted rate of change of the evaluation metric at discrete time intervals over the course of the model being in production.


