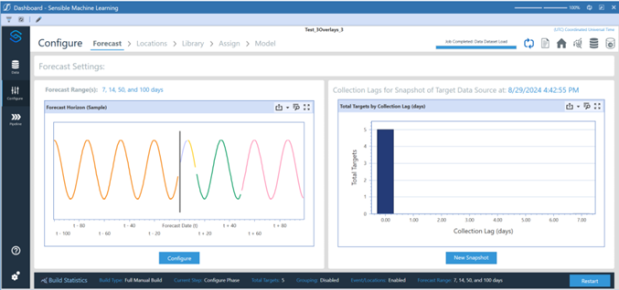
The Forecast page provides an easy-to-navigate step to set the desired forecast range. The forecast range is how far forward into the future the model is to forecast. The forecast range is dynamic based on the data set frequency (Days, Weeks, Months). Use the Forecast Range field in the Settings pane to set the forecast range.
The Forecast Horizon chart in the Settings pane displays an example of the configured forecast range. The line plot represents a pseudo-data set with the Actuals line representing the data set, the vertical line (Forecast Start Marker) representing the first data point of the forecast, and the Forecast line representing the additional forecasted data points. This representation shows what dates a forecast for your data would be over but is not your actual data nor your forecasted data.
Collection lag is the length of time between when a data point occurs and when that data point is collected.
Use the Forecast page to select the desired forecast range for your prediction runs. You can also run new data snapshots from this page.

Set the Forecast Range
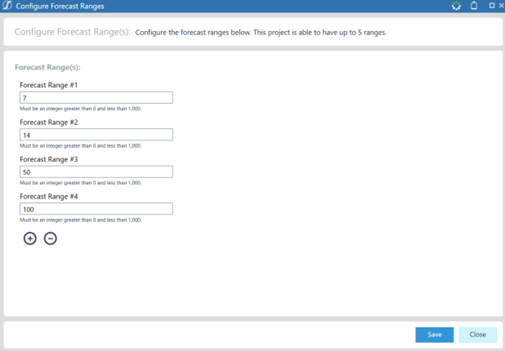
Use the Forecast page to set one or multiple Forecast Ranges, which determine how far forward from the latest date in the data set you want predictions generated for each forecast run. To configure the forecast ranges, follow these steps:

-
Click the Configure button to launch the dialog.
-
Input the desired forecast ranges for the Model build.
-
Use the add
 and remove
  buttons to adjust the quantity of desired forecast ranges to be run.
-
-
Once the forecast ranges are configured, click the Save button to commit them to the Model Build.
Once the forecast ranges have been configured, the Forecast Horizon chart will update to give a visualization of the varying lengths of the forecasts.


