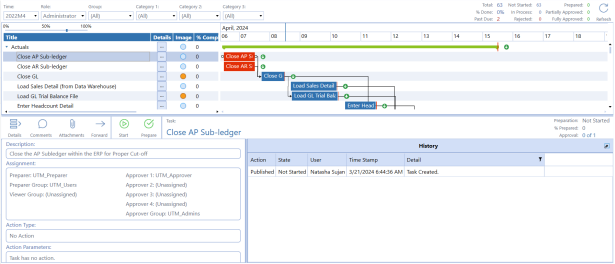
The Task Gantt View displays a Gantt chart with dynamic filters. Tasks presented on the Gantt chart turn from blue to red when a task becomes past due. The Gantt chart displays the Task Details pane on the bottom half of the page. The Gantt chart times are based on the user’s computer time.
Title
The name of the task.
Details
Click the ellipsis button in the row of the task to display its details in the Task Details pane on the bottom half of the page.
Image
An indicator showing the task’s state.
See Task Status Indicator for more information about each state indicator.
%Complete
The percentage a task or task group has been prepared.
NOTE: If a group contains tasks that a user cannot access, those tasks are not considered in the derived completeness calculation. This value matches the Scorecard completion value for any given group.
Start
The local date and time the task is set to begin.
The local date and time the task is due to be prepared.


