Task Analysis
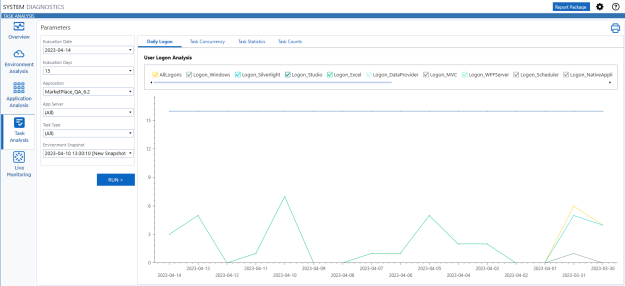
The Task Analysis page lets you query the number of tasks running in parallel over a given time frame by application, application server, task type, and environment snapshot. Use the Task Analysis page to run a daily log-on chart compared to environment resources.
The data is represented as a line chart in the Task Analysis page, with each line representing a daily logon type. Check boxes at the top of the chart let you exclude log-on types.
You can also hover over data points of the lines in the chart to see a count of daily log-ons for the highlighted log-on type in a pop-up. Data points occur on each date on the chart as defined by the evaluation criteria.
This page also provides access to the Task Concurrency, Task Statistics, and Task Counts pages. You can also print these charts by clicking on the printer icon in the top right corner of the task analysis page.
Upon clicking the Task Analysis tab, you will see the Daily Logon displayed in a line chart.
Chart Parameters
All pages available in Task Analysis work the same way. Select criteria in the parameters box to the left of the page to determine the data that displays on the chart. Criteria includes:
Evaluation Date: Date for which you want evaluation data to start.
Evaluation Days: Number of days before the Evaluation Date to evaluate and include on the chart. For example, if you select 2021-07-22 as the Evaluation Date and 15 for the number of evaluation days, the chart reflects data from 2021-07-22 to 2021-07-07.
Application: Select the name of the application you want to analyze data from the list. Applications in the list are based on your security role.
App Server: Select a specific application server to search or select the default (All) to include all application servers.
Task Type: Select a specific task type to evaluate or select the default (All) to include all task types.
Environment Snapshot (Daily Logon and Task Concurrency only): Select the snapshot that contains the data you want to use as the source for daily activity charting.
To create a new chart:
-
Use the fields located in the parameters box to update your chart.
-
Click RUN > to create the chart based on the defined criteria.
NOTE: After changing parameters, a message is displayed on the screen reminding you to click RUN > to refresh the chart.