Data Granularity and Learnable Data Patterns
Before understanding the influence of data volumes, it is important to understand how data granularity determines what data patterns can be learned by models. A data pattern is an underlying structure of a time series.
Common data patterns include:
-
Seasonality: A repeated pattern occurring on a constant frequency, for example weekly seasonality where the same sort of high and low point would occur on the same day of the week. There can be many forms of seasonality occurring within the same time series.
-
Trend: An underlying slope (linear or non-linear) that increases or decreases the time series average over time.
-
Anomalies (also known as outliers): An explainable or unexplainable data pattern that deviates from the normal seasonality or trend. These are typically one-off high or low points. In more extreme cases, these can surface as longer-term data shifts lasting weeks, months, or years.
It is best to address anomalies either by removing them or using features and events to inform models of their occurrence.
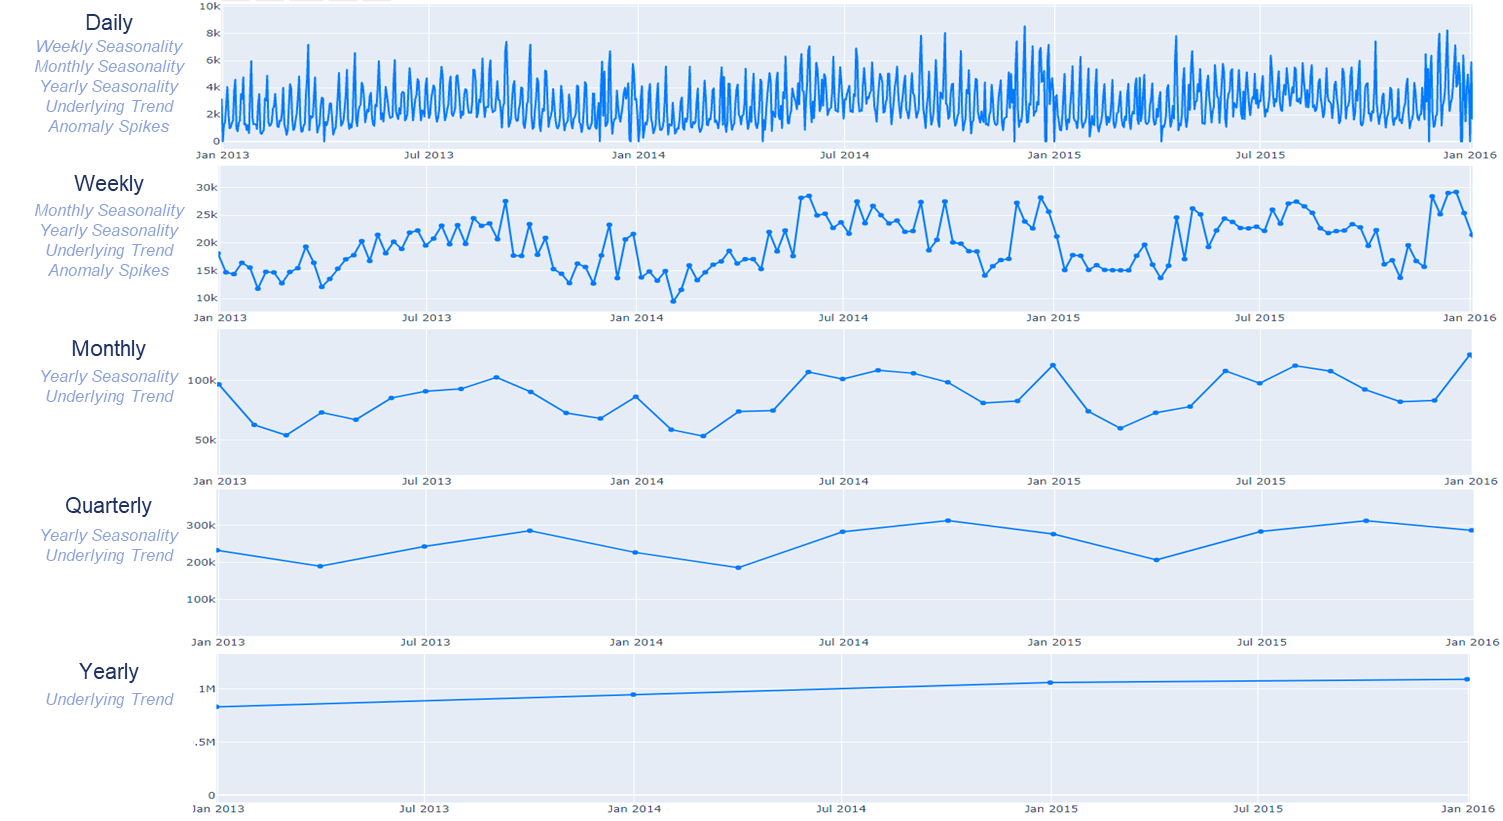
The following graphic overlays the same sales data at varying levels of aggregation (daily, weekly, monthly, quarterly, yearly). As aggregations continue up to yearly, different forms of seasonal variation and anomalies become hidden.
It is important to use the right tools for the forecasting job. Sophisticated machine learning models perform best when multiple seasonal variations and an underlying trend exist. Machine learning models leverage features to learn intricate seasonal patterns that exist within a time series to get the best line following result. Machine learning models are better suited for short range demand planning scenarios, where high daily forecast accuracy is needed, compared to more statistical based models.
Statistical based models are better suited for monthly, quarterly, or yearly data sets with fewer data patterns. This makes statistical models better at solving long range or growth-based use cases, since the business cares more about the underlying trend.
The following graphic shows general implications of fine grained versus coarse grained data granularity.
