Analyze Forecasts and Set a Forecast Range
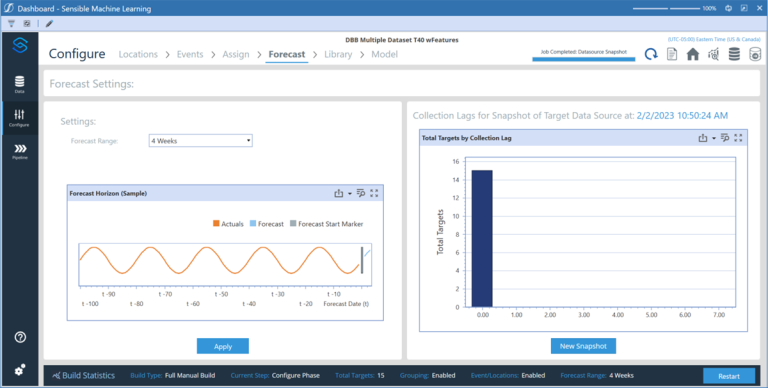
The Forecast page provides an easy-to-navigate step to set the desired forecast range. The forecast range is how far forward into the future the model is to forecast. The forecast range is dynamic based on the data set frequency (Days, Weeks, Months). Use the Forecast Range field in the Settings pane to set the forecast range.
The Forecast Horizon chart in the Settings pane displays an example of the configured forecast range. The line plot represents a pseudo-data set with the Actuals line representing the data set, the vertical line (Forecast Start Marker) representing the first data point of the forecast, and the Forecast line representing the additional forecasted data points. This representation shows what dates a forecast for your data would be over but is not your actual data nor your forecasted data.
Collection lag is the length of time between when a data point occurs and when that data point is collected. Click New Snapshot to take a snapshot of the collection lags for the target data source, then click Refresh  to refresh the page.
Use the Forecast page to select the desired forecast range for your prediction runs. You can also run new data snapshots from this page.
Set the Forecast Range
Use the Forecast page to set the Forecast Range, which determines how far forward from the latest date in the data set you want predictions generated for each forecast run. Click Apply after changing the forecast range.
The Forecast Range is stored and used for prediction runs.
See Collection Lag for more information on using collection lag and forecast range.
You must set forecast parameters for all targets before moving to the Library page.