Scorecard
The Scorecard provide charts that let you know immediately where tasks are in the preparation and approval process. All charts in the different Scorecard pages have drill down capabilities. Click on any chart bar, node, or pie area to drill down and display the associated tasks in the Task Details dialog box. Task statuses derive from the user’s time set on the User Preferences page.
Scorecard
See:
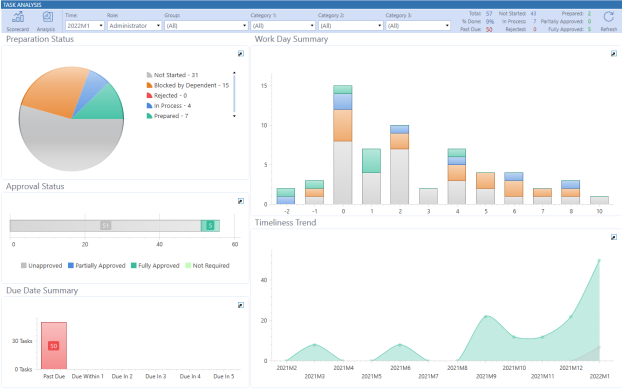
The Scorecard page provides an overview of where tasks are in terms of preparation status, approval status, and due date.
Each bar or pie piece in a chart shows the number of items in the section. You can also hover over a piece of a chart to display a pop-up showing the number of items. Click a bar or pie piece on a chart to display its tasks in the Task Details dialog box.
Preparation Status
This pie chart represents the total filtered task count by preparation status:
-
Not Started
-
Blocked by Dependent
-
Rejected
-
In Process
-
Prepared
Approval Status
This horizontal bar chart represents the total filtered task count by approval status:
-
Unapproved
-
Partially Approved
-
Fully Approved
-
Not Required
Due Date Summary
This vertical bar chart represents the total filtered task count by past due, due within one day, or due in two to five days.
Work Day Summary
This vertical bar chart represents the number of filtered tasks across the workdays for the selected time period. Select a column to display the tasks for that workday in the Task Details dialog box. You can also hover over any bar in the chart to display the number of tasks belonging to each preparation status.
Comments by Others
This grid displays when you filter on any role other than Administrator. Only administrators and local administrators will see the Administrator option in the Role drop-down menu. All comments made by other users to assigned tasks display in this grid. This grid works as a pivot chart, so you can drag and drop columns to create groupings.
Like other grids with columns in Task Manager, you can group comments by any column or column combination.
See Group Tasks that Display in Grids.
Timeliness Trend (Administrator role only)
This trend graph when you filter by the Administrator role. Only administrators and local administrators will see the Administrator option in the Role drop-down menu. It displays the total number of past due and on-time tasks for the selected time period over a trailing twelve-month period. Select a node to open the respective Task Details dialog box.
Scorecard – Simplified view
The Simplified scorecard view is an alternative view that displays when you select the Simplified Scorecard setting on the User Preferences page.
See User Preferences.
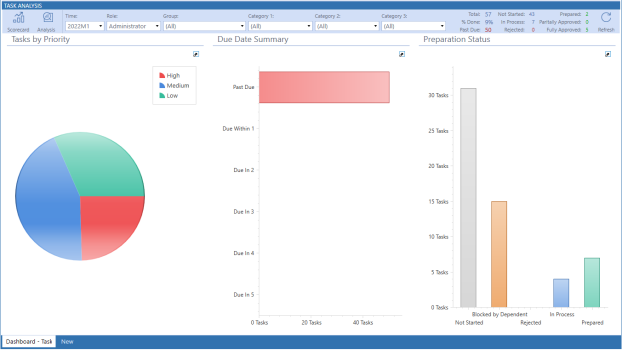
Tasks by Priority
This pane displays a pie chart that represents the percentage of High, Medium, and Low priority tasks. Hover over a section of the pie chart to see the number of tasks for the highlighted priority type.
Click a section of the pie chart to display and work with tasks for the selected priority in the Task Details dialog box.
Due Date Summary
Displays a bar chart that shows the number of tasks due in each of the next two to five days, as well as the number of tasks due within one day and the number of tasks past due. Hover over a section of the chart to see the number of tasks for the highlighted priority type.
Click a section of the pie chart to display tasks for the selected priority in the Task Details dialog box.
Preparation Status
This displays a bar chart that represents the number of Prepared, Blocked by Dependent, Rejected, In Process, and Not Started tasks. Hover over a section of the chart to see the number of tasks for the highlighted priority type.
Click a section of the pie chart to display tasks for the selected status in the Task Details dialog box.
See Task Details.