Dashboard Item Group
The BI Dashboard provides the capability to combine dashboard items into a group. The dashboard item group serves two main purposes:
-
Combine dashboard items within the dashboard into a separate layout group.
-
Manage interaction between dashboard items within and outside the group.
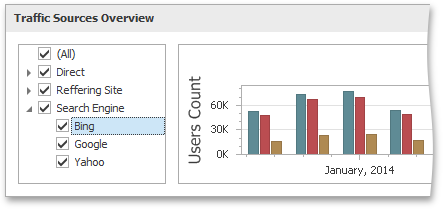
For instance, you can combine related filter elements and data visualization dashboard items into a group.
Create a Group
To create a new group, use the Group button in the Home ribbon tab.

You can add dashboard items to a group and manage item layout using drag-and-drop.
Note that a dashboard item group cannot be added to another group.
Interactivity
The dashboard item group provides the capability to manage interactions between dashboard items within and outside the group.
The Master Filter button allows you to specify whether the current group allows you to filter external dashboard items using master filter items contained within the group. If this option is disabled, master filter items contained within the group can filter only dashboard items from this group.
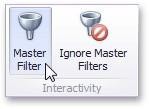
The Ignore Master Filters button allows you to isolate dashboard items contained within the group from being filtered using external master filter items.
Data Shaping
This section describes how to perform various data shaping operations (such as grouping, sorting and filtering) in the Dashboard Designer.
Summarization
To obtain numeric values that should be displayed within a dashboard item, Dashboard calculates a summary function against the specified measure.
This topic describes how to specify which summary function should be calculated against a particular measure.
Summary Function Types
The following summary functions are available:
Count: The number of values (excluding Null and DBNull values). This is the only summary type that can be calculated against non-numeric data.
Count Distinct: The number of distinct values.
Sum: The sum of the values.

Min: The smallest value.
Max: The largest value.
Average: The average of the values.

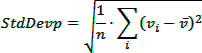
StdDev: An estimate of the standard deviation of a population, where the sample is a subset of the entire population.
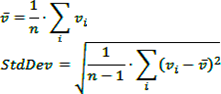
StdDevP: The standard deviation of a population, where the population is the entire data to be summarized.
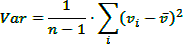
Var: An estimate of the variance of a population, where the sample is a subset of the entire population.
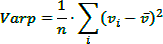
VarP: The variance of a population, where the population is the entire data to be summarized.
Median: The median of the values (excluding Null and DBNull values). A median is the number separating the higher half of a value range from the lower half.
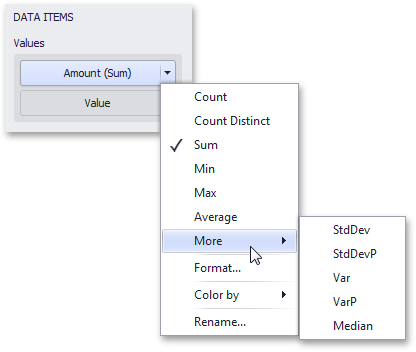
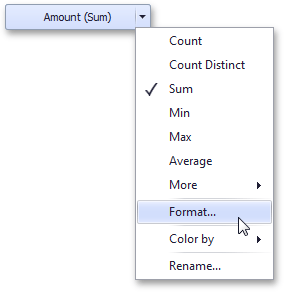
Changing Summary Type
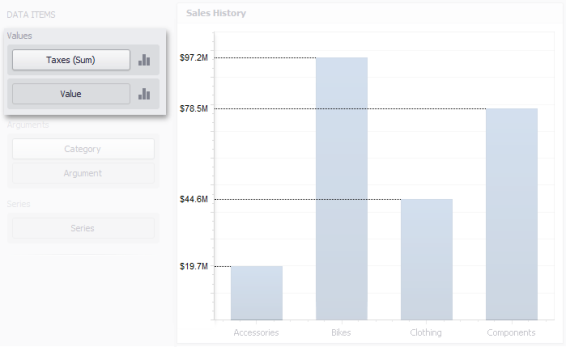
By default, Dashboard calculates Sum for numeric measures and Count for measures that contain another type of data.
You can change the summary function type for numeric measures. To do this in the Designer, invoke the data item menu and select the desired summary type. Less common summary types are organized in the More sub-menu.
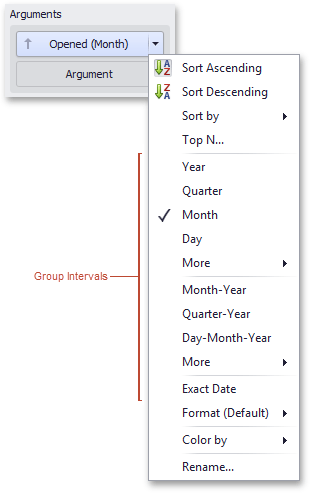
Grouping
The Dashboard Designer allows you to group dimension values and display summaries for entire groups rather than individual values.
You can arrange dimension values in groups of different sizes by specifying the appropriate group interval. For instance, date-time values can be grouped by years, months, quarters, etc.
This topic lists the supported text and date-time group intervals, and describes how to change the group interval.
Text Group Intervals
String values support the following grouping intervals.
| No Grouping |
Each value is displayed "as is". |
| Alphabetical | Values are grouped alphabetically (e.g., A, B, C, ... Z). |
Date-Time Group Intervals
Date-time values support the following group intervals.
Examples in the table below are formatted using the default settings.
| Group Interval | Description |
Examples |
|
Year |
Valuesare groupedbytheyear. |
2010,2011,2012 |
|
Quarter |
Valuesare groupedbythequarter. |
Q1,Q2,Q3,Q4 |
|
Month |
Valuesare groupedbythemonth. |
January,February,March,... December |
|
Day |
Valuesaregroupedbythedayof the month. |
1,2,3,...31 |
|
Hour |
Valuesare groupedbythehour. |
0,1,2,...23 |
|
Minute |
Valuesare groupedbytheminute. |
0,1,2,...59 |
|
Second |
Valuesare groupedbythesecond. |
0,1,2,...59 |
|
Day of the Year |
Valuesaregroupedbythedayof the year. |
1,2,3,...365 |
|
Day of the Week |
Valuesaregroupedbythedayof the week. |
Sunday,Monday,Tuesday,... Saturday |
|
Week of the Year |
Valuesaregroupedbytheweekof the year. |
1,2,3,...52 |
|
Week of the Month |
Valuesaregroupedbytheweekof the month. |
1,2,3,4,5 |
|
Month-Year |
Valuesaregroupedbytheyear and month. |
January2012,February2012,... December2012,January2013,... |
|
Quarter-Year |
Valuesaregroupedbytheyear and quarter. |
Q32012,Q42012,Q12013,Q2 2013,... |
|
Day-Month-Year |
Valuesaregroupedby date. |
3/4/2012,3/5/2012,3/6/2012,... |
|
Date-Hour |
Valuesaregroupedbydatewith the hour value. |
3/4/20120:00AM,3/4/20121:00 AM, 3/4/2012 2:00 AM, ... |
|
Date-Hour-Minute |
Valuesaregroupedbydatewith the hour and minute values. |
3/4/20120:00AM,3/4/20120:01 AM, 3/4/2012 0:02 AM, ... |
|
Date-Hour-Minute-Second |
Valuesaregroupedbydatewith the hour, minute and second values. |
3/4/20120:00:00AM,3/4/2012 0:00:01AM,3/4/20120:00:02 AM, ... |
|
Exact Date |
Eachvalueisdisplayed"as is". |
2009,Q22009,6/15/20091:45:30 PM, ... |
Changing Group Interval
To specify the group interval in the Designer, invoke the data item menu and select the desired group interval. Less common group intervals are organized in the More submenus.
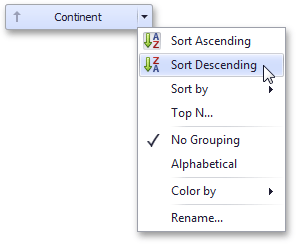
Sorting
The Dashboard Designer allows you to easily change the sort order of values within a dashboard item. You can also enable sorting by parameter values.
Changing Sort Order
The sort order of dimension values is indicated with an arrow.
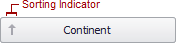
To change the sort order in the Designer, click the data item. You can also toggle sorting from the data item menu.
Sorting by Measure Values
Dashboard allows you to sort dimension values by summary values calculated for a specific measure. To enable sorting by measure in the Designer, use the Sort by submenu in the dimension's menu.
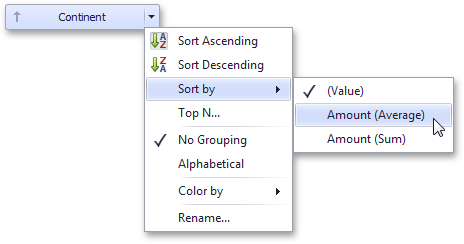
You can also sort dimension values by the values of hidden measures.
Filtering
The Dashboard allows you to filter a query of the SQL Data Source or apply filtering to a specific data-aware dashboard item.
This topic describes how to enable and reset filtering.
Apply Filtering
To configure filtering, select the target dashboard item and do one of the following:
-
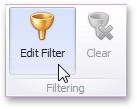
If you are using a Ribbon menu, click the Edit Filter button in the Data tab.
-
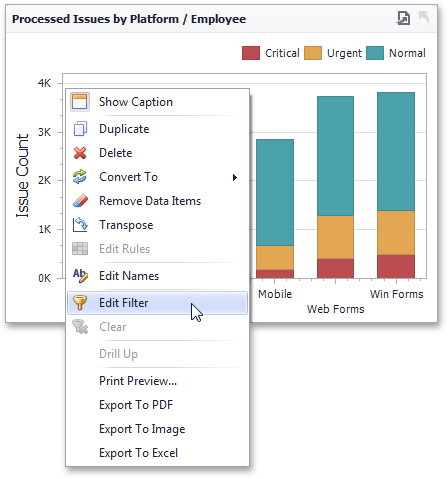
Right-click a dashboard item and select Edit Filter from its context menu.
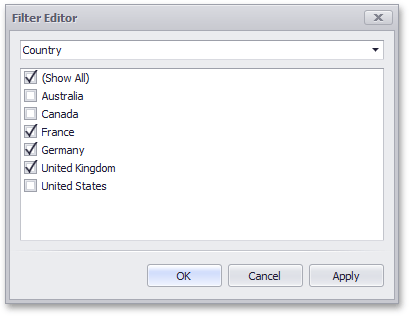
This will invoke the Filter Editor dialog. Use this dialog to build filter criteria with a convenient tree-like interface.
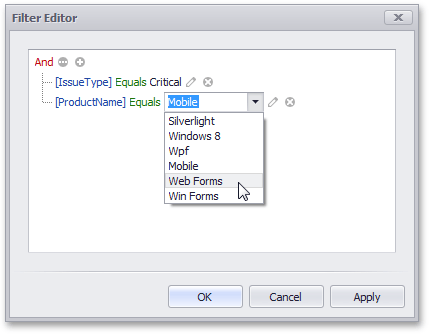
You can use hidden dimensions within the Filter Editor dialog, allowing you to filter data based on their values.
Clear Filtering
To clear filtering in the Designer, select the target dashboard item and do one of the following:
-
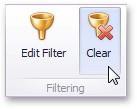
If you are using a Ribbon menu, click the Clear button in the Data tab.
-
Right-click a dashboard item and select Clear from its context menu.
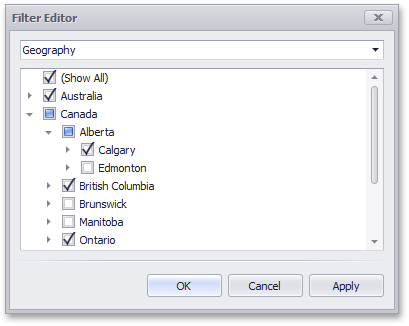
For hierarchies, a tree is displayed instead, allowing you to filter individual values at any hierarchy level.
Top N
The Top N feature allows you to display only a limited number of values that correspond to the highest or lowest values of a particular measure.
To display the top values in a dimension, select Top N from the data item menu.
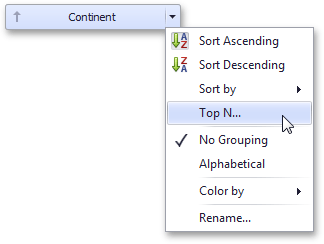
This invokes the Top N Values dialog.
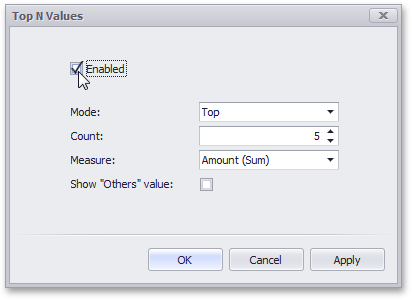
In this dialog, check the Enabled check box and specify the following settings.
|
Mode |
Specifies whether top or bottom values should be displayed. |
|
Count |
The number of values to be displayed. |
|
Measure |
The parameter that will determine the top or bottom value. |
| Show "Others" Value |
If enabled, all values that are not the top/bottom values are consolidated in the "Others" value. |
You can use the hidden measure as a parameter that will determine the top or bottom value.
Formatting Data
Dashboard allows you to customize various data format settings for numeric and date-time values.
Formatting Numeric Values
To specify a format for numeric values, select Format from the data item menu.
This invokes the Numeric Format window.
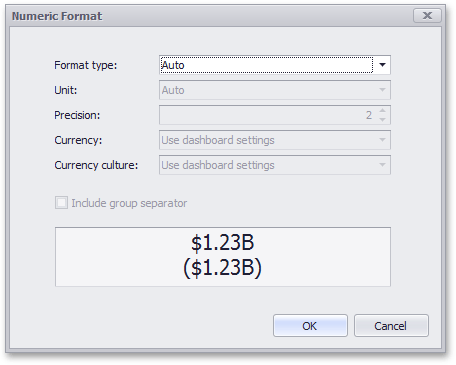
In the Format type field, select the required format type.
| Auto | Format settings are automatically determined based on the data type. |
|
General |
Converts a number to the most compact of either fixed-point or scientific notation, depending on the type of the number. |
|
Number |
Converts a number to a string of the "-d,ddd,ddd. ddd" form where "-" indicates a negative number symbol (if required), "d" indicates a digit (0-9), "," indicates a group separator, and "." indicates a decimal point symbol. |
|
Currency |
Converts a number to a string that represents a currency amount. To learn about currency formatting specifics, see the Currency Formatting Specifics section of this document. |
|
Scientific |
Converts a number to a string of the "-d.dddE+ddd" or "-d.ddde+ddd" form where each "d" indicates a digit (0-9). |
|
Percent |
Multiplies a number by 100 and converts it to a percentage string. |
Other format settings are in effect for only specific format types.
|
Setting |
Description |
Format Types |
|
Unit |
The unit to which values should be converted. | Number, Currency |
|
Precision |
The number of fractional digits that should be displayed. |
Scientific, Percent |
|
Currency |
Defines the currency sign and format settings that should be used to display currency values. To learn about currency formatting specifics, see the Currency Formatting Specifics section of this document. |
Currency |
|
Currencyculture |
For currencies used in a region with several cultures, specifies the culture that defines format settings. |
Currency |
|
Includegroupseparator |
Specifies whether or not separators should be inserted between digit groups. |
Number, Currency, Percent |
Formatting Date-Time Values
To specify a format for date-time values, use the Format submenu in the data item menu.
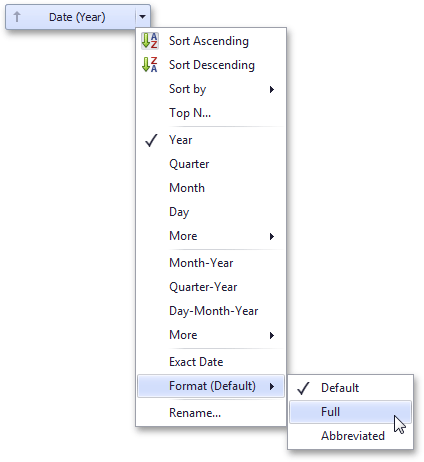
This submenu lists the available format types that depend on the selected group interval.
Specific group intervals do not have format options. This means that corresponding values can only be presented in a single manner. The Format submenu is not displayed for such group intervals.
The following list shows format types by group interval:
-
Year
-
Full: The full year pattern (Example - 6/15/2017 1:45:30 PM -> 2017 (en-US)).
Abbreviated: The year from 00 to 99 (Example - 6/15/2017 1:45:30 PM -> 17 (en-US)).
-
-
Quarter
-
Full: The full quarter pattern (Example: 6/15/2017 1:45:30 PM -> Q2 (en-US)).
-
Numeric: The quarter from 1 through 4 (Example: 6/15/2017 1:45:30 PM -> 2 (en-US)).
-
-
Month
-
Full: The full name of the month (Example: 6/15/2017 1:45:30 PM -> June (en-US)).
-
Abbreviated: The abbreviated name of the month (Example: 6/15/2017 1:45:30 PM -> Jun (en-US)). N u m eric - The month from 1 through 12 (Example: 6/15/2017 1:45:30 PM -> 6 (en-US)).
-
-
Hour
-
Long: Long hour pattern, 12-hour format (Example: 6/15/2017 1:45:30 PM -> 1:00 PM).
Short: Short hour pattern, 24-hour format (Example: 6/15/2017 1:45:30 PM -> 13).
-
- Day of Week
-
Full: The full name of the day of the week (Example: 6/15/2017 1:45:30 PM -> Monday (en-US)).
-
Abbreviated: The abbreviated name of the day of the week (Example: 6/15/2017 1:45:30 PM -> Mon (en-US)).
-
Numeric: The day of the week from 1 through 7 (Example: 6/15/2017 1:45:30 PM -> 2 (en-US)).
-
- Day-Month-Year
-
Long: Long date pattern (Example: 6/15/2017 1:45:30 PM -> Monday, June 15, 2017 (en-US)).
Short: Short date pattern (Example: 6/15/2017 1:45:30 PM -> 6/15/2017 (en-US)).
-
- Date-Hour
-
Long: Long date pattern, long hour pattern (Example: 6/15/2017 1:45:30 PM -> Monday, June 15, 2017 1:00 PM (en-US)).
-
Short: Short date pattern, long hour pattern (Example: 6/15/2017 1:45:30 PM -> 6/15/2017 1:00 PM (en-US)).
-
Time only: Long hour pattern (Example: 6/15/2017 1:45:30 PM -> 1:00 PM (en-US)).
-
- Date-Hour-Minute
-
Long: Long date pattern, long time pattern (Example: 6/15/2017 1:45:30 PM -> Monday, June 15, 2017 1:45 PM (en-US)).
-
Short: Short date pattern, long time pattern (Example: 6/15/2017 1:45:30 PM -> 6/15/2017 1:45 PM (en-US)).
-
Time only: Long time pattern (Example: 6/15/2017 1:45:30 PM -> 1:45 PM (en-US)).
-
- Date-Hour-Minute-Second
-
Long: Long date pattern, long time pattern (Example: 6/15/2017 1:45:30 PM -> Monday, June 15, 2017 1:45:30 PM (en-US)).
-
Short: Short date pattern, long time pattern (Example: 6/15/2017 1:45:30 PM -> 6/15/2017 1:45:30 PM (en-US)).
-
Tim e only: Long time pattern (Example: 6/15/2017 1:45:30 PM -> 1:45:30 PM (en-US)).
-
The list below illustrates format types related to the Exact Date group interval:
-
Year
-
Full: The full year pattern (Example: 6/15/2017 1:45:30 PM -> 2017 (en-US)).
-
Abbreviated: The year from 00 to 99 (Example: 6/15/2017 1:45:30 PM -> 17 (en-US)).
-
-
Quarter
-
n /a - The default year and full quarter pattern (Example: 6/15/2017 1:45:30 PM -> Q2 2017 (en-US)).
-
-
Month
-
n /a - The default year pattern and the full name of the month (Example: 6/15/2017 1:45:30 PM -> June, 2017 (en-US)).
-
-
Day
-
Long: Long date pattern (Example: 6/15/2017 1:45:30 PM -> Monday, June 15, 2017 (en-US)).
-
Short: Short date pattern (Example: 6/15/2017 1:45:30 PM -> 6/15/2017 (en-US)).
-
-
Hour
-
Long: Long date pattern, long time pattern (Example: 6/15/2017 1:45:30 PM -> Monday, June 15, 2017 1:00 PM (en-US)).
-
Short: Short date pattern, long time pattern (Example: 6/15/2017 1:45:30 PM -> 6/15/2017 1:00 PM (en-US)).
-
Time only: Long time pattern (Example: 6/15/2017 1:45:30 PM -> 1:00 PM (en-US)).
-
-
Minute
-
Long: Long date pattern, long time pattern (Example: 6/15/2017 1:45:30 PM -> Monday, June 15, 2017 1:45 PM (en-US)).
-
Short: Short date pattern, long time pattern (Example: 6/15/2017 1:45:30 PM -> 6/15/2017 1:45 PM (en-US)).
-
Tim e only: Long time pattern (Example: 6/15/2017 1:45:30 PM -> 1:45 PM (en-US)).
-
-
Second
-
Long: Long date pattern, long time pattern (Example: 6/15/2017 1:45:30 PM -> Monday, June 15, 2017 1:45:30 PM (en-US)).
-
Short: Short date pattern, long time pattern (Example: 6/15/2017 1:45:30 PM -> 6/15/2017 1:45:30 PM (en-US)).
Time only: Long time pattern (Example: 6/15/2017 1:45:30 PM -> 1:45:30 PM (en-US)).
-
Currency Formatting Specifics
The Dashboard allows you to specify a currency format at two levels: for the entire dashboard and for individual Data Items.
Data Item Currency
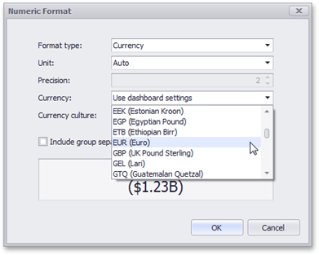
To specify which currency to use for a particular data item, select Format from the data item menu.
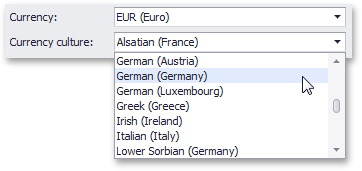
In the Numeric Format dialog, select Currency in the Format type field and use the Currency combo box to select the required currency.
This option only affects the way values are displayed. The Dashboard does not convert monetary amounts from one currency to another.
For regions with several cultures, you can also select the culture that will be used to format currency values.
You can also apply the default dashboard currency by selecting Use dashboard settings in the Currency field.
Dashboard Currency
You can also specify the default currency for the dashboard. This setting will be applied to dashboard items that have no currency defined.
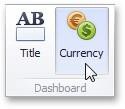
To set the dashboard currency, click the Currency button in the Ribbon.
This invokes the Dashboard Currency window. In this window, select the required currency using the Currency combo box.
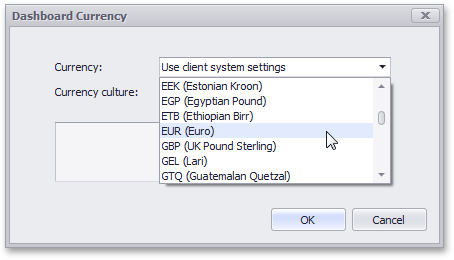
This option only affects the way values are displayed. The Dashboard does not convert monetary amounts from one currency to another.
For regions with several cultures, you can also select the culture that will be used to format currency values.
Additionally, you can specify the client culture that should be used for the dashboard by selecting the Use client system settings item. In this instance, the current system culture will be used in WinForms applications, and the client culture will be used in Web applications.
Interactivity
This section describes features that enable interaction between various dashboard items. These features include Master Filtering and Drill-Down.
Master Filtering
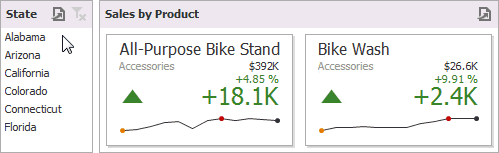
The Dashboard allows you to use any data aware dashboard item as a filter for other dashboard items (Master Filter). You can select elements in a Master Filter item (grid records, chart bars, pie segments, etc.) to filter data in other dashboard items by the selected values.
Master Filtering Overview
Dashboard items can be divided into four groups by their master filtering capabilities.
Data visualization dashboard items allow you to enable master filtering by specifying the selection mode.
-
Filter elements represent a special type of dashboard item whose main purpose is to apply filtering to other dashboard items. This capability is always enabled for these dashboard items.
The following filter elements are available:
-
Combo Box
-
List Box
-
Tree View
Instead of switching between standard master filtering modes, some filter elements allow you to switch their type. This allows you to select a single value or multiple values.
-
Range Filter is a special type of dashboard item that displays a chart with selection thumbs and allows you to filter out values displayed along the argument axis.
-
Dashboard item group allows you to manage interaction between dashboard items in and out of the group.
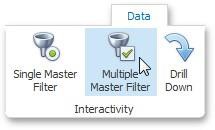
The Master Filter item supports two selection modes:
-
Multiple: Allows you to select multiple elements in the Master Filter item.
-
Single: Allows you to select only one element in the Master Filter item. When this mode is enabled, the default selection will be set to a Master Filter element. You can change this selection, but cannot clear it.
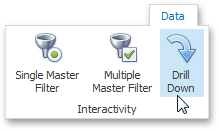
To enable/disable master filtering, use the Multiple Master Filter or Single Master Filter buttons in the Data Ribbon tab.
If the selected dashboard item contains several types of elements that can be used for filtering, the Ribbon or Toolbar will provide the appropriate buttons to switch between these types (e.g., the Arguments and Series buttons in the Chart).
Filtering Across Data Sources
When different items in a dashboard are bound to different data sources, you can specify that a particular Master Filter should be applied across data sources. This means that it will apply filtering to fields with matching names in all data sources.
Fields are matched by their full names. For fields in other data sources to be affected by Master Filtering, their names must match the name of the field in the current data source, and they must belong to the same hierarchy level so that their full names also match. For instance, Customer City and Customer Address. City will not be treated as matching fields.
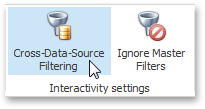
To enable filtering across data sources, use the Cross-Data-Source Filtering button in the Data Ribbon tab.
Preventing Items from Being Filtered
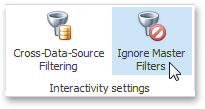
You can prevent specific dashboard items from being affected by Master Filters. To do this, use the Ignore Master Filters button in the Data Ribbon tab.
Apply Filtering
To learn how to apply filtering in a specific dashboard item, refer to the Master Filtering topic in the Interactivity section for this item.
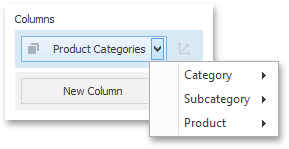
Drill-Down
Dashboard provides the Drill-Down feature, which allows you to change the detail level of data displayed in a dashboard item. The Drill-Down feature enables users to drill down to display detail data, or drill up to view more general information.

EnableDrill-Down
Drill-down requires that the data section contains several dimensions or a hierarchy data item.
To enable drill-down, click the Drill-Down button in the Data Ribbon tab (or the button if you are using the toolbar menu).
If the selected dashboard item contains several types of elements that can be used for drill-down, the Ribbon or Toolbar will provide the appropriate buttons to switch between these types (e.g., Arguments and Series buttons in a Chart). For details, refer to the documentation for the individual dashboard items in the Designing Dashboard Items topic.
The following dashboard items support the Drill-Down feature:
-
Chart
-
Scatter Chart
-
Grid
-
Pies
-
Cards
-
Gauges
-
Treemap
Perform Drill-Down
To learn how you can drill down using a particular dashboard item, refer to the Drill-Down topic in the Interactivity section for this item.