Deploy Your Model
The Deploy page provides information that lets you fully analyze and understand the effectiveness of your model before deploying it to production. Once satisfied, you deploy your model using this page, which collects necessary information from the pipeline job to be able to run the deployed models in utilization. This information includes:
-
The most optimal hyperparameters for deployed models.
-
How to generate and transform features selected for the deployed models.
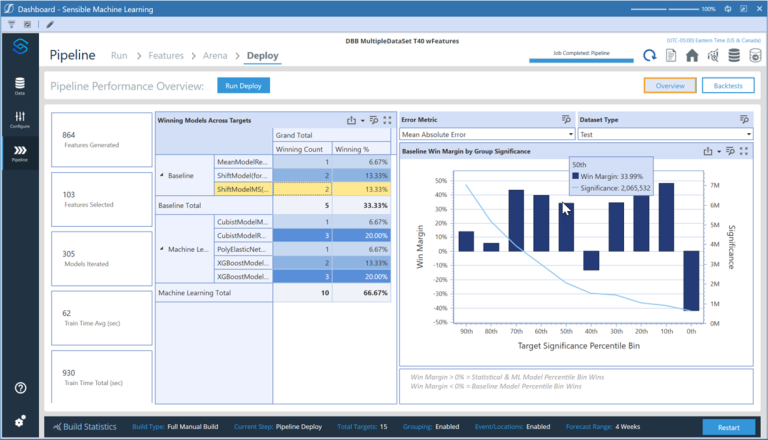
Analyze Pipeline Performance Overview Statistics
General statistics shown here include:
Features Generated: Number of features generated for the entire data set.
Features Selected: Number of features selected for the data set based on being able to positively contribute to predictive accuracy.
Models Iterated: Number of times models were iterated with different hyperparameter settings during the pipeline job.
Train Time: Total train time across all targets and target groups during Pipeline. This total time is not sequential however, as much of the Pipeline is run in parallel through the XperiFlow Conduit Orchestration.
The charts on this page include:
“Best” Models: Descending bar chart that visualizes the breakdown of best models selected across all targets, so you can understand how frequently different models and model types are winning.
Baseline Win Margin by Group Significance: Each bar in this chart represents an even-sized bin of targets. Bar heights indicate the percent by which the best statistical or machine learning model beat or lost to the best baseline model based on the selected error metric, summed across all targets within the bin.
The light blue line in the chart represents the bin's total significance. Bin refers to the value amount selected during the Data section, such as total units or dollars. Positive win margins are ideal. This means that machine learning and statistical models are beating the simplistic models on average.
It is possible however, for a bar to be negative due to an instance where the best baseline model beats the best machine learning or statistical model. For example, in a ten-target bin, nine machine learning and statistical models can beat the best baseline by 10 percent each, but one baseline model that wins by 120 percent can swing the bar to be negative.
Use the Overview view to get valuable insight by analyzing the Best Models and Baseline Win Margin by Group Significance charts. This can help answer questions such as:
-
How often are my machine learning and statistical models beating the best baseline model?
-
By how much are my best machine learning and statistical models beating the best baseline model?
-
Are the best baseline models being beaten for my most significant targets? This is specific to non-units-based value dimensions, such as sales dollars.
Analyze Backtest Results
The Backtests view provides an aggregated view of how well the models selected during Pipeline performed for the whole data set. It provides a similar view to the Train page, but does so in relation to the holdout set of data.
Use information in the Backtest view to get valuable insights by analyzing evaluation metrics across models and targets. This can help answer questions such as:
-
Which type of model has the best accuracy for a given target?
-
Did actuals often fall within the prediction interval bounds?
-
Which features are important to predictions of different models for different targets?
-
By how much did the model win?
-
How close are the forecasted values to the actuals in the line chart?
-
Are there spikes that aren’t being caught by the forecasts? If so, could adding any events help catch these spikes?
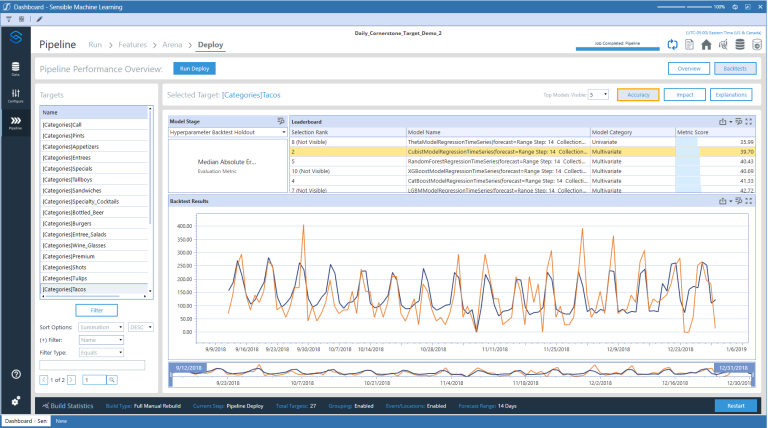
Deploy Backtest Accuracy View
To analyze the training results in the Backtests view, click a target in the Targets pane to see the accuracy of each of its deployed models compared to its past data. Each model displays its name and category, type of evaluation metric used, and the evaluation metric score. Select a model in the models list to view a line chart that shows how close the forecasted values are to the actuals.
You can review the available statistics and visualizations for each target before deploying the models for utilization.
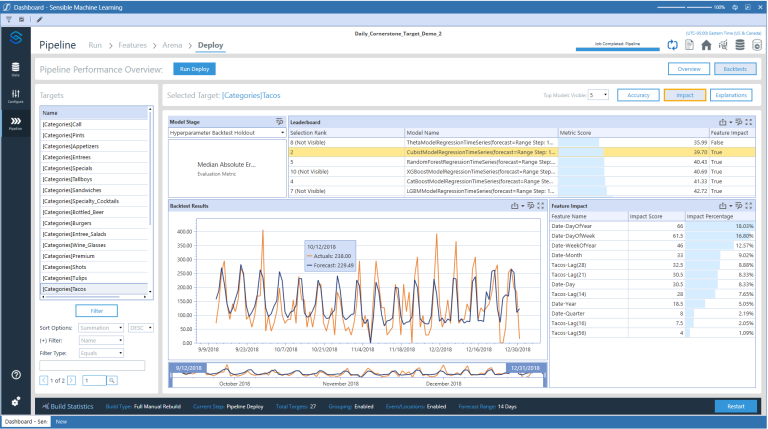
Deploy Backtest Impact View
The Impact view shows the same information as the Accuracy view, but also includes the feature impact scores for different models. Any target that is a part of the model build can have its models examined in this view. The feature impact score shows how much influence the feature had for a given model. It is the same as the Arena Backtest Accuracy View but is on the holdout set of the split. Only models with features have feature impact data.
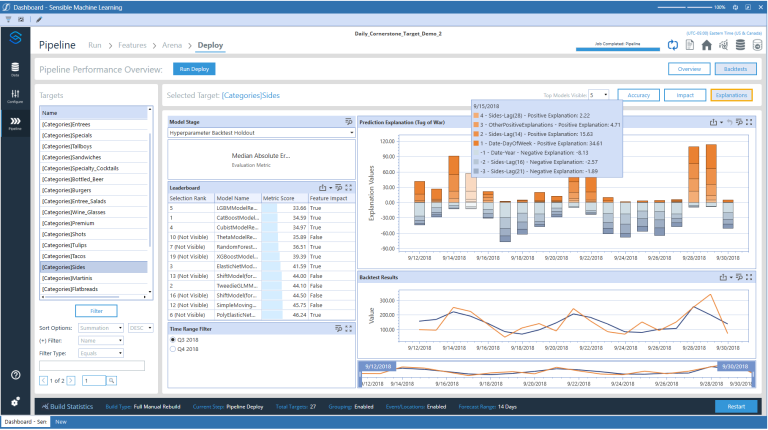
Deploy Backtest Explanation View
The Explanation view shows the model metrics, predictions, and prediction intervals (if configured) in different model stages similar to the Accuracy View. The Explanation view also includes the prediction explanations of the models. Select a model from the Leaderboard grid to see its prediction explanations in a Tug of War plot on right side. This plot shows for each data point the features that had the largest magnitude effect (negative or positive) on the prediction for that date. Any target that is a part of the model build can have its models examined in this view. It is the same as the Arena Explanation view but is on the holdout set of the split. Only models with features have feature explanation data.
TIP: To drill down into a specific date, double-click the date in the tug-of-war plot to see a feature-by-feature view of prediction explanations for that date.
Deploy Your Model
After reviewing the available statistics and visualizations for each target, click the Run Deploy button. This creates the deployment job, which upon completion changes the project's status and moves the project from the Model Build phase to the Utilization phase.
The deployment job takes the best models selected during pipeline and deploys them for generating forecasts.
Additionally, after the models have been chosen for deployment, Sensible Machine Learning creates the feature schemas and pre-trained models needed to run predictions against the models in the Utilization phase.