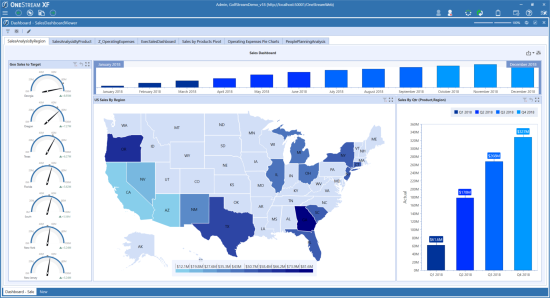
This is an Interactive Dashboard Engine that is used to quickly create a Business Intelligence (BI) visualization of data from existing or new Data Adapters. The user can quickly create BI Dashboards that will allow the user to visualize and analyze data.
The BI Dashboards are a powerful tool and allow the user to dynamically add data and build Charts, Gauges, Maps, Grids, Cards. Etc. This BI component integrates well with the cube view MD Data adapter, allows the user at design time to; Add Calculated fields to the Data Source to create new fields and measures, design a path for Drill Down, Multi-Select filtering and Conditional formatting for dynamic viewing at runtime and provides the ability Customize Palette Colors.
Key Elements of the BI Viewer
-
Compatible with existing dashboards
-
Simple to build, share, and reuse components
-
Fast drag and drop ad hoc data exploration
-
Easily combine OneStream and non-OneStream data
-
Bring trusted, validated OneStream data to the masse
Key Items for a Quick Start
-
Data Adapter – used to source the data and render the dataset
-
BI Viewer Component – to design the dashboard
-
Dashboard Component – to display the BI Dashboard
-
Literal Parameter (optional) – to store the color palette


