Click  to preview a completed Dashboard. Once in preview mode, Parameters may need to be entered, and then click Ok to get the Dashboard to run. Click
  to go back to Parameters and run the Dashboard again under a different input value.
Click  to toggle back to design mode.
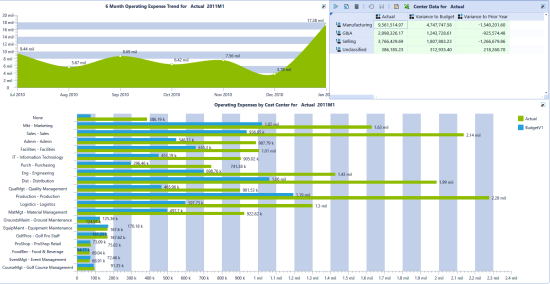
The example above shows a Dashboard with two Chart Components and one Data Explorer Component.
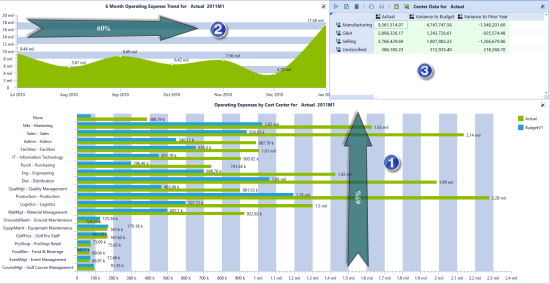
In this example above, there are three Components listed in the Dashboard Components tab in the order in which they appear on the screen.
Component 1 has the Dock Position set to Bottom and Height to 65%.
Component 2 has the Dock Position set to Left and Width to 60%.
Component 3 has the Dock Position set to any position such as Right and all other setting were left blank. The Dashboard will automatically dock this last Component to fill the rest of the available space.
Set layout type to Tabs in order to view each Component in its own tab.

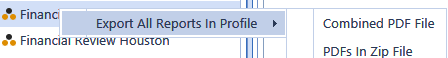
By right clicking on a Profile under OnePlace Dashboards on the left in the Navigation Pane, a user can export all the Dashboards in the Profile out to a combined PDF file. Right click and choose Export All Reports in this Profile… and then choose Combined PDF File or PDFs in Zip File. This is a quick and easy way to produce Report books. The only exception is that currently graphs and charts do not export to PDF in these mass forms.