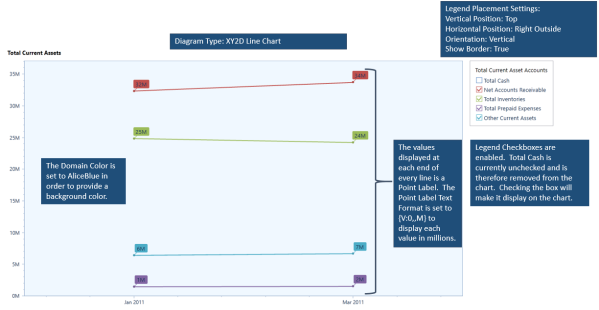
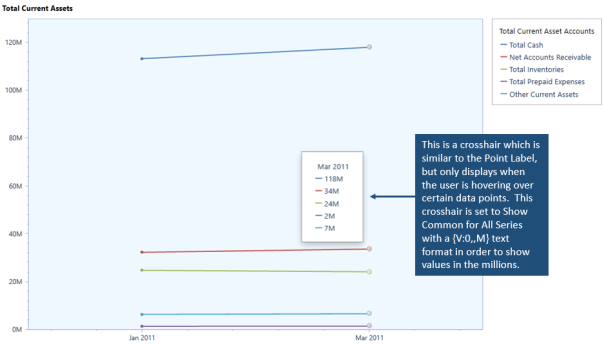
XY2D Line Chart Examples
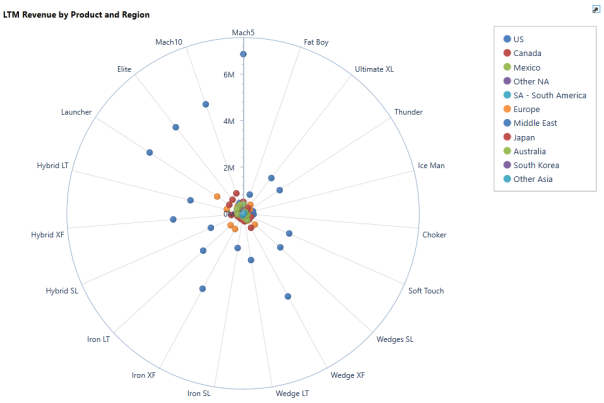
Radar2D Radar Point Example
The chart below is displaying product revenue by region. This data is driven by a Cube View where the Cube View Rows display the region and the Cube View Columns display the products. Only the Y axis can be customized with this chart type which is driven by the Cube View data. The Legend is driven by the Members on the Cube View Rows and the column Members display multiple axes organized in a circle.