Dashboard design mode makes it easy to design and edit dashboards because it pinpoints exactly where the desired change needs to be made. Dashboard in design mode displays a dashboard draft and all the dashboard maintenance unit items associated with it. You can then select different sections of the maintenance unit hierarchy which highlight that portion of the completed dashboard, or select a portion of the dashboard and be directed to that exact item in the maintenance unit.
To run a dashboard in design mode:
-
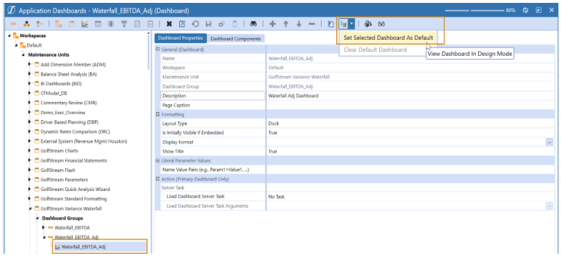
Select the dashboard to which changes need to be made and set it as the default dashboard.
-
Click
 to run the dashboard in design mode.
Design Mode
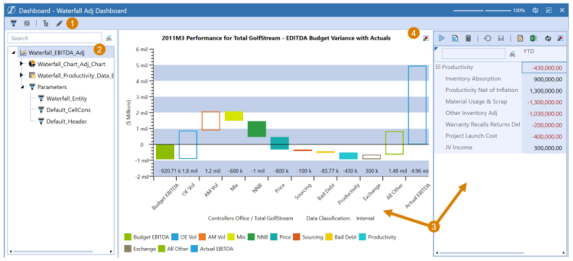
The following describes the design mode page elements.
TIP: Highlight a specific dashboard item (such as a data adapter or component) and select this icon to go directly to that item in the dashboard maintenance screen.
-
Toolbar:
 Click this to hide or display the Dashboard Maintenance Unit items.
 Click this to go back to maintenance mode.
TIP: Highlight a specific dashboard item (such as a data adapter or component) and select this icon to go directly to that item in the dashboard maintenance screen.
-
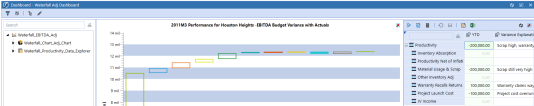
Dashboard Maintenance Unit items: This provides the entire dashboard maintenance hierarchy for the default dashboard. For more complex dashboards, use the search to find the desired item. This dashboard example contains one chart component, one cube view component and the custom substitution variables used (parameters and their variables). Hover the mouse over each item to display a tool tip that identifies the value currently being used. Each component has its own data adapter.
-
Dashboard Draft: This is the default Dashboard.
-
Find Tree Item
 When a user clicks this icon, the maintenance items involved in this part of the Dashboard are highlighted in the tree. For example, to change the dashboad title above, click to see what part of the maintenance hierarchy controls the chart
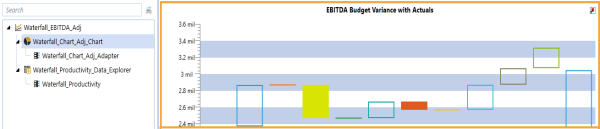
This indicates exactly where these changes can be made.
Click
 to return to edit mode and it navigates directly to the chart component selected in design mode
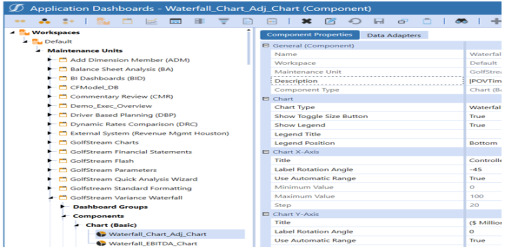
Make the necessary changes and preview it once more in design mode to see the outcome.
NOTE: Authoring dashboards which are designed to contain more than six levels of nested dashboards is a rare use case and not recommended. When viewing in the Silverlight web browser, results may be inconsistent. If there is a desire to nest dashboards to this level or beyond, it is recommended to use the OneStream Windows application interface.


