Navigation links let you set up one dashboard to launch another in order to drill into more detail or related detail on a certain row of data from a report, while other times it can create a chart of the reviewed data.
The following information provides a detailed example including the steps one must take to create Navigation Links. The implementation of this feature will differ, but for this example an Income Statement Summary Dashboard will launch another Dashboard with more detail:
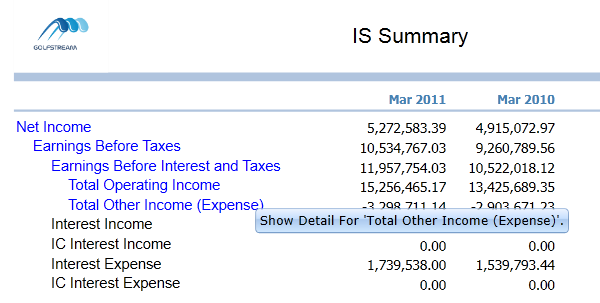
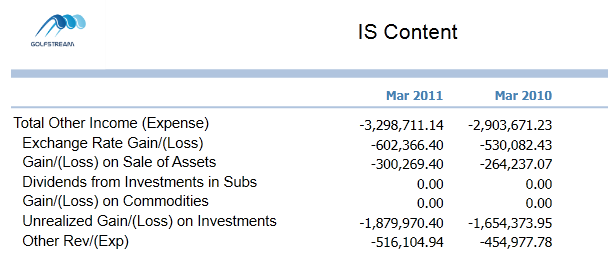
Click Total Other Income (Expense) to display the following dashboard:
NOTE: This only works in dashboard mode.
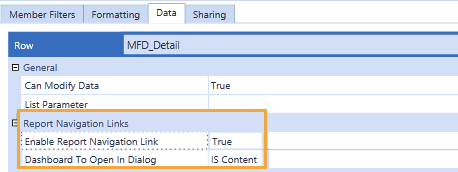
Below is a sample cube view called IS Summary which contains income statement summary accounts. First, select the row to be highlighted for navigation. Set Enable Report Navigation Link to True and type the name of the dashboard to open in the Dashboard to Open in Dialog field. The specified dashboard (not a cube view) opens when this highlighted row is selected from this cube view’s related dashboard.
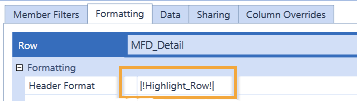
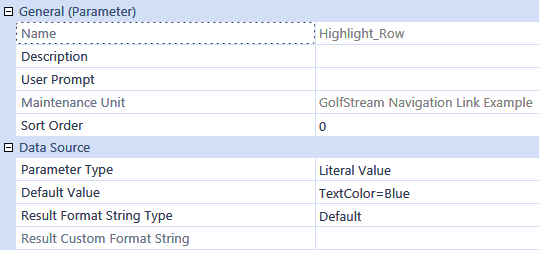
This next step is optional. Add a header format using a cube view style. This displays the row in a color different from the other rows to indicate the row is clickable. In this case, |!Highlight_Row!| is related to a parameter that was made in a sample application. When this cube view is run, the format of TextColor=Blue activates for this row.
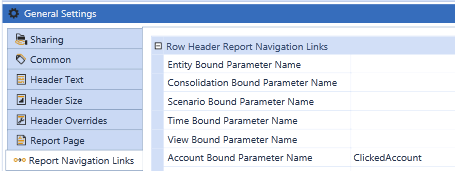
The cube view passes the clicked account to the other dashboard and there the account and its children can be viewed. Now, determine how the account is to be passed. Go to the General Settings slider and go to the Report Navigation Links section. A value of ClickedAccount was entered for the Account Bound Parameter Name which is going to be passed from one dashboard to another. More than one dimension can be passed if it is defined in rows, but in this case this does not need to happen.
Copy  this cube view to have the same columns and POV settings for the drilled cube view containing the contents. This one is called IS Content because it contains the content of the drilled data. Whatever it is called, be consistent and come to an agreement with the project team.
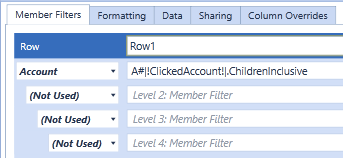
In the new cube view (called IS Content in this case), remove the rows that were there and add the rows that will be seen when this Dashboard appears. In this case, refer to the parameter for ClickedAccount and add the ChildrenInclusive extension.
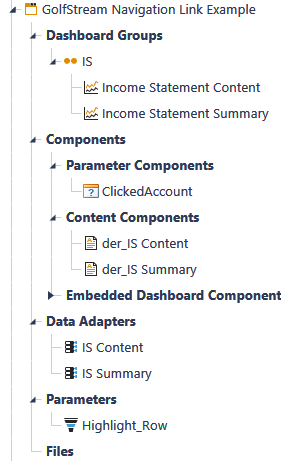
Under dashboards, a maintenance unit  was created and called GolfStream Navigation Link Example, which stores all the objects needed to get this to work properly.
Starting from the bottom of the example above is the parameter  needed to highlight the row.
The data adapters  are required to point to the cube views. First, set up one for IS Content. Set the Command Type to Cube View and set the cube view to IS Content.
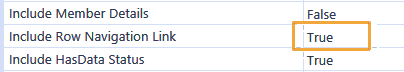
Next, set up the data adapter for IS Summary. Set the Command Type to Cube View and set the cube view to IS Summary. Set the Include Row Navigation Link property to True to drill from Cube Views in a Dashboard.
Now, set up two content components for a dashboard. Namethese with the prefix of der_ because they are data explorer reports and not charts or another form of component. Again, come up with a naming schema with the project team, so the result is organized. In this case, click  to create a component and chose Data Explorer Report as the type. Do this for both IS Summary and IS Content and click
  in the dashboard toolbar to attach the appropriate data adapter to each.
Select Parameter Components and create a new component with a type of Supplied Parameter. In the Bound Parameter field, enter the name of the parameter being passed, which is ClickedAccount in this example. Do this for each parameter being passed from dashboard to dashboard.
Create a dashboard group (called IS in this example) and two dashboards. Create one for the launching dashboard (for example, IS Summary) and one for the launched dashboard (for example, IS Content). In this example, a layout of Uniform is being used, but the use of this feature may vary.
Under Dashboard Components, attach the data explorer report component. Do this for both IS Summary and IS Content. For just the IS Summary (the launched dashboard), also attach the parameter component being passed (ClickedAccount in this example). This allows that account to be passed from the initial dashboard to the other.


