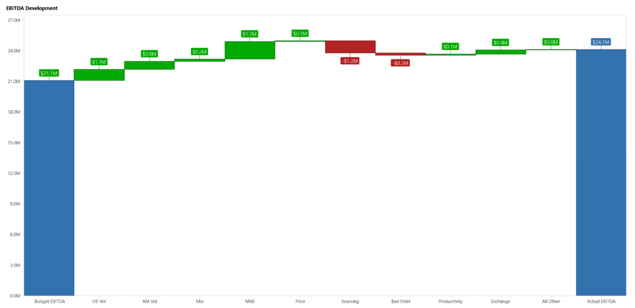
A waterfall chart, also known as a Walk or Bridge chart, is a type of chart that provides a visual story of the net changes of values between two identified points, such as starting and ending values in income statements, balance sheets, and operational expenses. You can build a waterfall chart with data supplied in a particular format from a Data Adapter. You can also convert existing BarRangeSideBySideWaterfall charts to the new waterfall chart type.
Waterfall charts display net changes of a single value per bar. They provide positive variance values above the bar and negative variance values below the bar.
Create a Waterfall Chart
-
Go to Application > Presentation > Workspaces.
-
Expand the appropriate Maintenance Unit.
-
Click the Components label and then click the Create Dashboard Component button.
-
In the Create Dashboard Component window, click Chart (Advanced) and then click theOK button.
-
In the Name field, type a name for the new waterfall chart.
-
Scroll down to Series Properties and from the Type field, select Waterfall.
-
Click the Save button.
NOTE: If you have an existing BarRangeSideBySideWaterfall chart type, you can change it to waterfall by selecting Waterfall from the Type field.
When you select Waterfall, the Waterfall Series Properties section provides configurations specific to the Waterfall chart:
-
Start Bar Color: Sets the color of the first bar in the series.
-
Total Bar Color: Sets the color of the bar that represents a Total.
-
Rising Bar Color: Sets the color of all bars whose values are positive, but are not Start or Totals.
-
Failing Bar Color: Sets the color of all bars whose values are negative, but are not Start or Totals.
-
Total Included in Series: Indicates if the data source includes a total value. When set to True, the chart identifies the last value in the data source as a Total bar on the chart. When set to False, the chart auto-calculates a sum and adds the result as a Total bar on the chart.
-
Total Value Label: Sets the label of the Total bar.
-
Include Subtotals: Indicates auto-calculated subtotals added to the waterfall chart. When set to True, you can indicate where you want to place the subtotal bars. If False, no subtotals are defined. The default value is False.
-
Subtotal Indexes: Enter a comma-separated list of numbers to indicate where you want your subtotal bars to be placed. For example, to display a subtotal after your first delta value, you would enter 1. You can also enter 2,4, which would display a subtotal after the second delta value and the fourth delta value. These numbers count the delta values.
-
Subtotal Labels: Enter a comma-separated list of labels for each subtotal. Each label needs to have unique text. The number of labels must equal the number of subtotal indexes specified. If nothing is listed, this property defaults to Subtotal 1, Subtotal 2, Subtotal 3, and so forth.
-
Subtotal Bar Color: This sets the color of bars that represent a subtotal. This property defaults to XFDarkBlueBackground.
-
Label Position: Sets the position of the bar labels. The default is Auto. You can choose from the following options:
-
Auto: Labels are placed above the bar for rising values and below the bar for falling values.
-
Center: Labels are placed in the center of the bars.
-
InsideEnd: Labels are placed on the inside bottom of the bar for falling values and on the inside top of the bar for rising values.
-
InsideStart: Labels are placed on the inside bottom of the bar for rising values and on the inside top of the bar for falling values.
-


