IMPORTANT: Profiler should be used by developers.
Profiler captures every event processed in a user session, such as Business Rules, Formulas, and Workspace Assemblies. This enables you to view the input and output of a method or function. Any code processed inside OneStream is profiled during a session. The ability to view the inputs and outputs of a method or function can be used to help troubleshoot performance issues. Profiler is tied to user activity and does not capture activity at the application level.
| System Security Role | |
| ManageProfiler | Users assigned to this role can run Profiler sessions and view Profiler Events. The default is Administrator. |
| System User Interface Role | |
| ProfilerPage | Users assigned to this role can view the Profiler page. They cannot run Profiler sessions or view Profiler Events. The default is Administrator. |
NOTE: Administrators can end any active Profiler session.
![]()
To start a Profiler session, click the Start Profiler button.

To end all active sessions, click the Stop All Profiling for User button.

To only display active Profiler sessions, select the Show Running Items Only checkbox.
To run a Profiler session, complete the following steps:
-
Click the Start Profiler button.
-
In the Start Profiler window, enter Profiler properties if needed. None of the following fields are required to run a session:
Property Description General Description Enter a session description to display on the Profiler page. Number of Minutes to Run This entry determines how long Profiler will run after a session has started. The session automatically ends after the allotted time. The default value is 20 and the max value is 60. Values over 60 will be reset to the default value.
Number of Hours to Retain Before Deletion The Profiler session is deleted after the time entered has passed. The default value is 24 and the max value is 168. Values over 168 will be reset to the default value.
NOTE: The Profiler session is deleted in the first server restart after the deletion time.
Filters Include Top Level Methods This captures and displays high-level entry points, such as user actions, API calls, or workflow steps. When set to True, Profiler will log this activity. When set to False, no top-level methods display in the Profiler Events window.
NOTE: Child Events are still visible when this filter is set to False. For example, if you have a Data Adapter that references a Workspace Assembly call, the Profiler Events will display the WSAS call as a child event within the Adapter event type.
Include Adapters This includes any Data Adapter component calls to the Profiler output. When set to True, Profiler will log this activity. When set to False, no adapters are listed in the Profiler Events window, even when the Show All Child Events checkbox is selected. Include Business Rules This includes Business Rules in the Profiler output. When set to True, Profiler will log this activity. When set to False, no Business Rules are listed in the Profiler Events window, even when the Show All Child Events checkbox is selected. Business Rule Filter This entry determines what Business Rules are displayed in the Profiler Events window. See Filter Syntax.
Include Formulas This includes formulas in the Profiler output. When set to True, Profiler will log this activity. When set to False, no formulas are listed even when the Show All Child Events checkbox is selected. Formula Filter This entry determines what Formulas are displayed in the Profiler Events window. See Filter Syntax.
Include Assembly Factory This includes Assembly Method calls in the Profiler output. These are labeled as Factory to differentiate between Assembly Factory and Assembly Method calls. When set to True, Profiler will log this activity. When set to False, no Assembly Factories are listed even when the Show All Child Events checkbox is selected. Include Assembly Methods This includes Assembly Method calls in the Profiler output. These are labeled as WSAS to differentiate between Assembly Method and Assembly Factory calls. When set to True, Profiler will log this activity. When set to False, no Assembly Methods are listed even when the Show All Child Events checkbox is selected. Assembly Method Filter This entry determines what methods are displayed in the Profiler Events window. See Filter Syntax.
NOTE: For the fields Number of Minutes to Run and Number of Hours to Retain Before Deletion, if the default values are deleted and no value is entered, Profiler will still default to these settings when a session is run. If a zero is entered for both fields, Number of Minutes to Run defaults to one minute, and Hours to Retain Before Deletion defaults to one hour.
-
Click the Start button. A new instance is displayed on the Profiler page.
-
Run the Business Rule, Formula, or Workspace Assembly you want to profile. When finished, navigate back to the Profiler page. To end the session, find your session on the Profiler page and click the Stop Profiler button for that line item.
To delete a Profiler session, click the Delete Selected Item button. You cannot delete Profiler sessions that are actively running.

To end a singular session, click the Stop Profiler button.
![]()
To display all Profiler property settings for a session, click the Instance Information button. Profiler Settings are view-only and cannot be modified once you have started the session.

To display the Profiler Events window and view all child events, click the Profiler Events button.

IMPORTANT: Application performance may be impacted if multiple users are running Profiler at the same time or performing long-running tasks while other users are running Profiler.
Filter Syntax
Use the Business Rule Filter, the Formula Filter, and the Assembly Method Filter to determine what is displayed in the Profiler Events window. For example, if you enter GetDataSet in the Assembly Method Filter, the filter only displays these methods.
The following wildcards are valid syntax:
-
A question mark functions as a placeholder that accepts any character in its place.
Example: If you enter SS?B in the Business Rule Filter, only sources that match this filter are displayed, such as SSIB and SSVB.
Example: If you enter A#????? in the Formula Filter, the filter only displays sources starting with A# followed by five characters.
-
An asterisk indicates that any string can be added before or after the hard-coded string that is next to the asterisk.
Example: If you enter *Validation in the Business Rule Filter, only rules ending with Validation are included.
Example: If you enter P* in the Assembly Method Filter, the filter only displays methods that start with P.
NOTE: You can use multiple filters separated by a comma. For example, TableEditorTest* , Spreadsheet???????, IBM?nSave.
Profiler Events
To display the Profiler Events window, navigate to the session you want to view and click the Profiler Events button. The Profiler Events window displays everything that occurred during the Profiler session with Top Level Events displayed as parents.

To display child events for all Top Level Events, select the Show All Child Events checkbox.

To drill down into a single Top Level event, click the Child Events button for that line item. This opens an additional Profiler Events window that only displays the child events for the selected Top Level event. If the Top Level event does not have any child events, the icon is grayed out for that item.


Review the following table for Profiler Events column descriptions:
| Column | Description |
|---|---|
| Event Type | The following event types are displayed in this column: Top, Queue, Adapter, Formula, BR, Factory, WSAS, and Manual. |
| Workspace | This column displays the name of the Workspace containing the item that caused the event. |
| Source |
This column identifies the origin of the profiled event. Its value varies depending on the event type being profiled.
|
| Method | This column displays the method called. |
| Description | This column displays a description of the event type. |
| Entity | This column displays the name of the Entity dimension member associated with the event. This column is blank if the event is not tied to a specific entity. |
| Cons | This column displays the name of the Consolidation dimension member. This column is blank if the event is not related to a consolidation. |
| Duration | This column displays the duration of the event type. |
| Server | This column displays the server. |
| Thread ID | This column indicates the operating system thread identifier on which the event was run. |
Post Processing
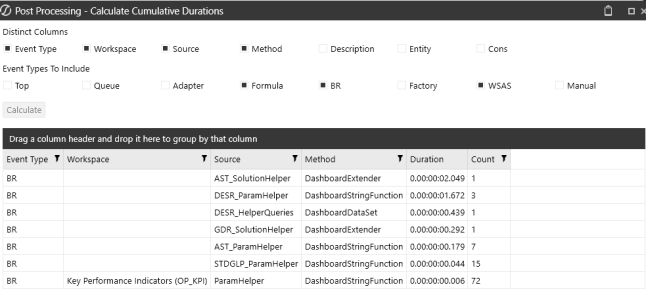
To display the Post Processing - Calculate Cumulative Durations window, click the Post Processing button.

You can use the Post Processing - Calculate Cumulative Durations window to view information on different groupings, total all filtered items, and see what was returned. This information can help improve performance queries. For example, if you are looking specifically at performance time, you can filter by specific event types and have them grouped together. This enables you to view which specific methods or events are taking longer than others. When you run a calculate, the grid displays the duration and count for all Event Types selected in addition to selected Distinct Columns.
To run post processing, make selections from Distinct Columns and Event Types To Include and then click the Calculate button. Distinct Column selections will display as columns in the grid, and Event Types To Include selections will display as rows in the grid. The following Distinct Columns and Event Types To Include are selected by default: Event Type, Workspace, Source, Method, Formula, BR, and WSAS.


NOTE: Updating the Distinct Column or Event Types To Include checkboxes after running a calculate will clear the results.
Event Information
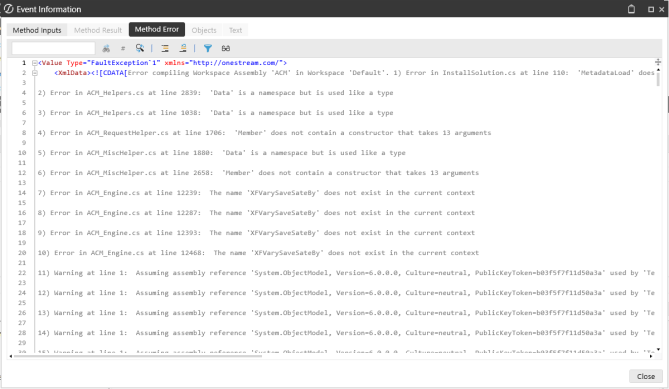
To view Method Inputs, Method Results, and Method Errors for an event, click the Event Information button. The Events Information window contains the following tabs:
-
Method Inputs tab: This displays the parameters or data passed into the method or event.
-
Method Result tab: This displays the outcome or returned values of the method run.
In the following example, the New Dashboard with Time Stamp button component was clicked, which called the 3_TimeStamp dashboard and the GetAdoDataSetForSqlCommand method.

The Event Information window displays all method inputs, including the SQL Query and the date stamp submitted when the dashboard opened.

The Method Result tab displays the time stamp that was returned to the dashboard.

-
Method Error tab: This displays any errors encountered during the session, providing thorough troubleshooting potential.

-
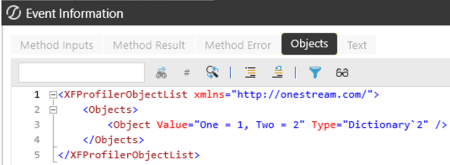
Objects and Text tabs: These are enabled for Manual event types if objects or messages are logged through BRApi calls.
In the following example, a user has the BRApi call attached to a button interaction to log the relevant information.

In the Event Information window for Manual event types, the user can view the BRApi.Profiler.LogMessage description in the Text tab and the BRApi.Profiler.LogObjects in the Objects tab.


BRApi.Profiler Methods
Reference the following calls directly in your business rules or application logic using the BRApi.Profiler prefix.
IsProfiling
This call determines if profiling is currently enabled for the session. This is useful for checking whether to log additional profiling information or to skip profiling logic for performance.
Use BRApi.Profiler.IsProfiling(si). si is your current SessionInfo object.
LogMessage
This call records a custom message to the Profiler Events log. This can be used to log checkpoints, user actions, or important events during business rule processing.
Use BRApi.Profiler.LogMessage(si, brProfilerSettings, "Description", "Detail").
-
si: This is your current SessionInfo object.
-
brProfilerSettings: This is your profiler settings object. Use null if not applicable.
-
"Description": This is a short description of the event.
-
"Detail" (Optional): This is any additional detail.
Example: You can use the following API call to log a message when a button is clicked: BRApi.Profiler.LogMessage(si, brProfilerSettings, "Button clicked", "User clicked the 'Process' button.")
LogObjects
This logs the state of one or more objects to the Profiler Events log. This is useful for capturing the values of key objects at specific points in your process for diagnostics or auditing.
Use BRApi.Profiler.LogObjects(si, brProfilerSettings, "Description", [object1, object2, ...]).
-
si: This is your current SessionInfo object.
-
brProfilerSettings: This is your profiler settings object. Use null if not applicable.
-
"Description": This is a short description of the event.
-
[object1, object2, ...]: These are the objects whose states you want to capture.


