After you have processed and merged the data sets for your SensibleAI Forecast project, data analysis for each target becomes available. Click the Explore Targets and Features  icon in the SensibleAI Forecast toolbar to access the page.
TIP: The Explore Targets and Features page is only available during the Model Build phase.
The Data Elements pane on the Explore Targets and Features page shows the data elements represented in the information on the page. The information on the page changes depending on whether you are viewing targets or features. Target information displays by default.
To change the data elements represented on the page, select Features or Targets in the Series Type field click Filter.
Target Data

Each target in the data source displays with the following information:
-
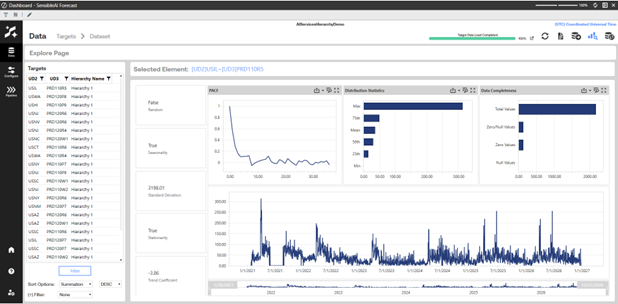
Random: Indicates if a data set does not contain any recognizable patterns. This signifies that it may be difficult for models to learn from historical data.
-
Seasonality: Indicates if a data set contains any seasonal patterns or cycles that repeat over a period of time. If a data set has seasonality, models can use it to increase predictive accuracy.
-
Standard Deviation: Indicates the standard deviation of the target.
-
Stationarity: Indicates if the statistical properties of the data set do not change over time.
-
Trend Coefficient: This is the result of a Mann Kendall test which produces a value between -1 and 1. A coefficient greater than zero indicates the statistical significance of a positive trend. A coefficient less than zero indicates the statistical significance of a negative trend.
-
Partial Autocorrelation Function (PACF) Plot: Demonstrates correlation (-1 to 1) of values based on the time increment between them. For example, a daily-level data set with a PACF score of 0.5 at an x-axis point of 7 signals that, on average, today’s value has a correlation coefficient of 0.5 with the value of 7 days prior.
-
Distribution Statistics: Bar chart representing these values: Maximum, 75th percentile, Mean, 50th percentile, 25th percentile, and Minimum.
-
Data Completeness: Bar chart representing how many zero or null values are found for each target of the data set.
-
Historical Actuals Plot: Plots all the historical actuals from the data.
Feature Data

Each feature in the data source displays with the following information:
-
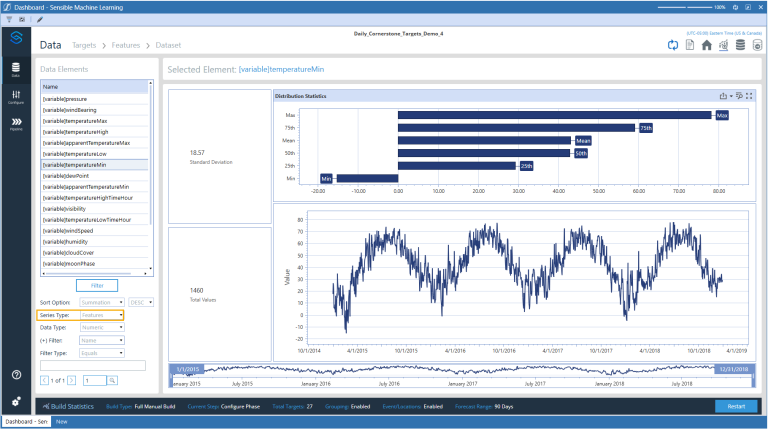
Standard Deviation: Indicates the standard deviation of the feature.
-
Total Values: The number of unique values created by feature data.
-
Distribution Statistics: Bar chart representing these values: Maximum, 75th percentile, Mean, 50th percentile, 25th percentile, and Minimum.
-
Historical Actuals Plot: Plots all the historical actuals from the data.


