The following sections describe the different ways to navigate in SensibleAI Forecast.
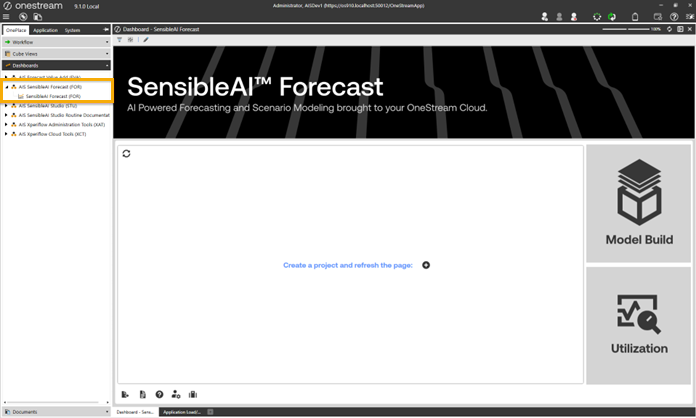
SensibleAI Forecast Home Page
The Home page displays when you click on the SensibleAI Forecast. This is the starting point to creating and managing your Sensible Machine Learning projects.dashboard in Community Solution.

Use the Home page to:
-
View project and build status. See Create a Model Build Project.
-
Add
 , delete
  , update
  , and copy
  projects, and refresh
  the list of available projects.
 -
Update your data source
 for existing projects. See Update a Target or Feature Data Source.
 -
Import and Export Project configurations
 for existing projects. See Project Configurations.
 -
Manage existing projects through the Model Build and Utilization phases. See Model Build Phase and Utilization Phase.
-
View and extract System Logging Tables
 . See View System Logging Tables.
 -
View the AI Services log
 . See View AI Services Activity.
 -
Access this User Guide
 .
. -
Configure global settings
 . See Settings.
 -
Launch Feature Package Manager
 . See Feature Package Manager.
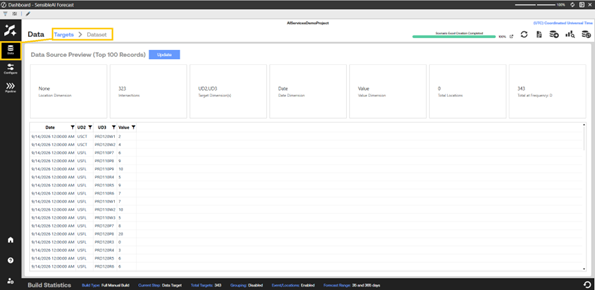
Navigate SensibleAI Forecast Pages
When you are in Model Build or Utilization, the left side navigation includes different sections and the top left navigation shows the pages available in the selected section.

Toolbar Icons
Each page in the Model Build and Utilization phases includes a set of buttons at the top right of the page that provide additional navigation, project update, settings, or analysis functions.
| Icon | Description |
|---|---|

|
Shows status of most recently started non-queued or scheduled job for the current SensibleAI Forecast project. Click to see additional execution details of the current job in the Job Progress dialog box. See View Job Progress. |
 Refresh Refresh |
Refresh and update the current SensibleAI Forecast page. |
 AI Services Log AI Services Log |
Opens the AI Services log where you can review job errors, job activity, and tasks that have run or are currently running for specific jobs. See View AI Services Activity. |
 Home Home |
Navigate to the project Home page. |
 Explore Targets and Features Explore Targets and Features |
View and run exploratory data to analyze each target and feature in the data set. Only available in the Model Build phase after completing the Dataset step of the Model Build. See Explore Target and Feature Data. |
 Show Data Update Show Data Update |
Opens a page where you can update target and feature data sets. This is only available after completing the Dataset step of the Model Build. See Update a Target or Feature Data Source. |
 Consumption Groups Consumption Groups |
Opens the Consumption Groups Dialog box, which lets you create, delete, and export consumption groups. Only available after completing the Dataset step of the Model Build. See Manage Consumption Groups. |
Chart and Table Toolbar Buttons
Charts and tables in the Model Build and Utilization phases include toolbar buttons for inspecting and exporting data and maximizing and minimizing the table or chart.
| Icon | Description |
|---|---|
 Inspect Inspect |
Drills into the data to view it in aggregated or raw form. All data inspect windows provide a Print Preview option from which you can save or print the data. |
 Export to Export to |
Exports data in the chart or table to Print Preview, PDF, Image, or Excel |
 Maximize Maximize |
Maximizes the chart or table in the workspace. |
 Minimize Minimize |
Minimizes the chart or table. |
Review Build Statistics and Restart a Project Build
Build Statistics display at the bottom of each SensibleAI Forecast page and provide the project status and other details specific to the current page.
Model Build Phase Build Statistics
Build statistics provide you with a quick summary of information about the model in the Model Build phase.

The Build Statistics in the Model Build phase include:
Build Type: The type of build, such as Full Manual Build.
Current Step: The project build's current model build section, such as Configure Phase.
Total Targets: Total number of targets for the current project build.
Grouping: Indicates if grouping is being used in the project build.
Event/Locations: Indicates if events and locations can be used in the project build.
Forecast Range: The number of days, weeks or months to forecast forward. The default is seven days, or three months, or four weeks. Changes made on the Forecast page in the Model Build section are reflected here.
Restart a Project Build
You can restart a SensibleAI Forecast project using the Build Statistics pane. You should only restart a project if a mistake is made during the Model Build phase that would require too much effort to fix or to create another project.
When running a restart, you can redo these model building steps:
-
Change the data sets used for the modeling project.
-
Modify target and feature data set configurations, and groupings.
-
Add new locations and events or reconfigure existing location and event data, reinstall event packages.
-
Remap events and locations to targets.
-
Reset the project's forecast range.
-
Rerun a pipeline.
IMPORTANT: A restart project job cannot be canceled once it starts.
To restart a project build for the current project:
-
Click Restart in the Build Statistics pane.
-
In the Restart dialog box, select a restart option:
Restart: This reverts the project back to the Data section of the Model Build phase, prior to the Dataset page.
Restore: Lets you begin a job based on a specified checkpoint in the project. Select the job from the list, then enter the ID of the selected job in the text box that displays. Selecting this option navigates you to the Home page
NOTE: Restarting using the Restart Job option can cause a loss of data such as predictions and configurations collected after the specified checkpoint.
-
Click Confirm to begin the restart job, then click OK in the message box that displays to close the Restart dialog box. For the Restore option, this navigates you to the Home page. For the Restart job option, this navigates you to the Data section, prior to the Dataset page.
Delete a Project Build
You can delete a project build using the Build Statistics pane. This functionality is available if the build is a rebuild. You should only delete a project build if a mistake has been made or if the rebuild is no longer required.
NOTE: This only deletes the project build that is being rebuilt. The project's deployed builds and the project itself are not deleted.
To delete a project build:
-
Click Restart in the Build Statistics pane.
-
In the Restart dialog box, select Delete as the option.
-
Click Confirm.
SensibleAI Forecast deletes the project and returns to theHome page.
Restore
You can also restore a job from a Job Checkpoint using the Build Statistics pane. This lets you select a recent checkpoint of a job (such as Data, Configuration, Pipeline, or Auto-Rebuild) and revert to that point in the model build.
IMPORTANT: This capability is an advanced feature and should be used only under known circumstances. Restoring a Job can result in the loss of historic job information including but not limited to task, job, and prediction information and records. For this reason, this functionality should be reserved for known circumstances.
To restore a job:
-
Click Restart in the Build Statistics pane.
-
Select Restore as the restart option.
-
Select the job checkpoint you would like to restart. Click Confirm.
The full project now has the exact settings, configurations, and statuses that were present at the time of the selected checkpoint. (Dave, I will provide a bit more detail here post Friday's meeting due to legal concerns.)
NOTE: You are not able to re-enter the project in either Model Build or Utilization until the restore job is complete. The Restore job cannot be reverted or canceled.
IMPORTANT: Once the job has been reverted, all previously available checkpoints no longer exist.
Utilization Phase Build Statistics
Build statistics provide you with a quick summary of information about the model in Utilization phase.

The Build Statistics in the Utilization phase include:
Health Score: Ranges from -1 to 1 <--FIXED AFTER GAindicating improvement or degradation in the model's predictive accuracy. The Health Score shows the change of Evaluation Metric Scores with each new prediction run, averaged.
Next Forecast: Date and time of next forecast. If no forecasts are scheduled, this shows No Forecasts Scheduled.
Last Forecast: Date and time of the last forecast.
Forecast Range: The number of days, weeks or months to forecast forward.
Total Targets: Total number of targets.
Total Groups: Total number of groups.
Sort Data in Tables
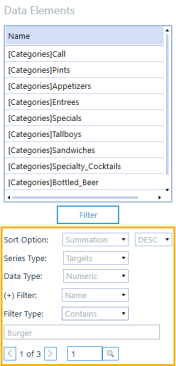
Tables for targets and features may contain a lot of entries. You can filter the displayed entries by changing the sort options and series type. You can also move through specific pages to locate entries.

TIP: Sort options are specific to the current page. The sort options displayed in the previous graphic are an example from the Data Explore page.
Sort Option: Sort by specific column in ascending (ASC) or descending (DESC) order.
Series Type: Options are targets or source features. Only available on the Data Explore page.
Data Type: Numeric. Only available on the Data Explore page.
(+) Filter: Optional. Use to filter results based on a specific column.
Filter Type: Available if Filter is selected. Method of filtering (equals, not equals, or contains).
Input Text Box: Available if Filter is selected. Select the value to apply for the filter type.
Page Number: Click a page number to go to that page.
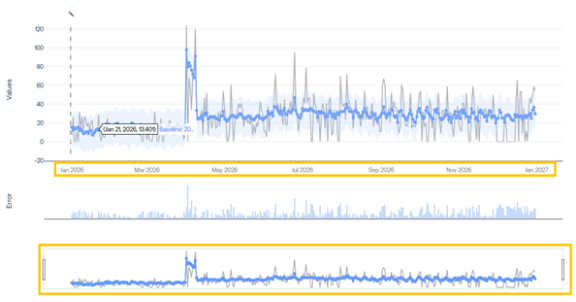
Date Range Sliders for Line Charts
Line charts provide a date range slider that lets you drag and drop to adjust the start and end dates for the content visualized in the chart.


