The AI Services Activity Log provides critical insight into:
-
Job traffic and activity.
-
All tasks run for a job.
-
The completion status of all SensibleAI Forecast jobs.
-
Why a job may not have completed successfully.
You can review this information at any time in the project creation process or during model build or utilization phases.
Access the Activity Logs
To open the AI Services Log, click  at the top of any SensibleAI Forecast page. This button is also available on the SensibleAI Forecast Home page.
The log displays an overview, the job activity, and the error log for SensibleAI Forecast. In the overview section, you can view all jobs that are running or have run. You also have the ability to narrow down jobs based on time periods, job type, solution, projects, and username. This section includes higher level statistics regarding currently running jobs and information on environment resources being used that can be cross referenced when running new jobs. In the Jobs pane, each job can be expanded to show all tasks and their status.
Overview Section
Look Back Period: Filters jobs based on the specified period of time to look back in.
Job Type: The job type that was run.
Solution: The name of the application where the job completed.
Projects: Project name given to the SensibleAI Forecast project when it was created.
Username: Username of the user that created the SensibleAI Forecast project.
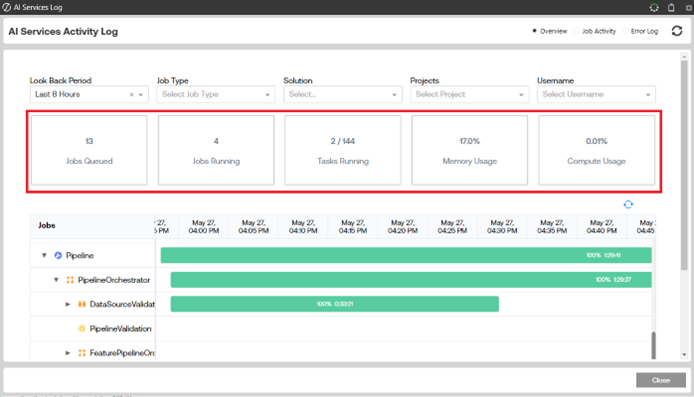
Statistics Pane: Statistics about the engine resources being used to run projects/tasks.
-
Jobs Queued: How many jobs in the environment are currently waiting in the queue to execute.
-
Jobs Running: How many jobs in the environment are currently running.
-
Tasks Running: How many tasks are running across the environment.
-
Memory Usage: For the current environment, how much memory is currently being allocated towards running jobs or tasks (displayed as a percentage of possible memory).
-
Compute Usage: For the current environment, how much compute is currently being allocated towards running jobs or tasks (displayed as a percentage of possible compute).
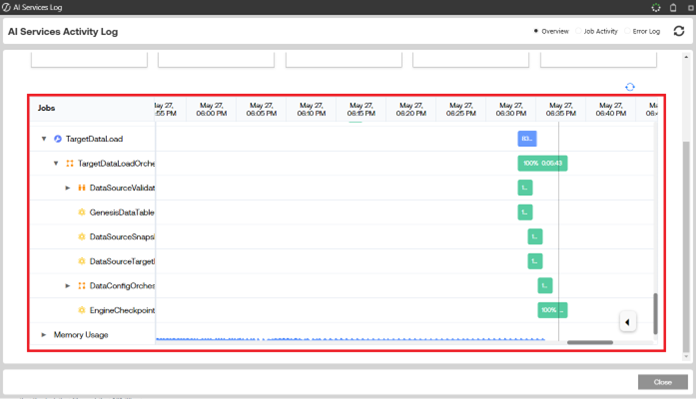
Jobs Pane: Shows jobs that have been run and status of jobs that are currently running.
-
Collapsible Jobs: All tasks pertaining to a job are encapsulated in the overarching job that was run.
-
Time Slicing: In the bottom right corner, users can expand the arrow to slice time periods anywhere from 5 minutes to 6 hours.
-
Color Coordinated Execution Status: Displayed to show a certain color depending on the status of the job.
-
Blue: Currently Running.
-
Green: Successfully Completed.
-
Red: Job Failed.
-
-
Job Coordinated Icons: Each icon is mapped to a type of job.
-
 : Job.
 -
 : Routine.
 -
 : Atomic Task.
 -
 : Sequential Task.
 -
 : Parallel Task.
-
• Memory Usage: Running graph of current memory usage over time.
• Compute Usage: Running graph of current compute usage over time.
Monitor Job Activity
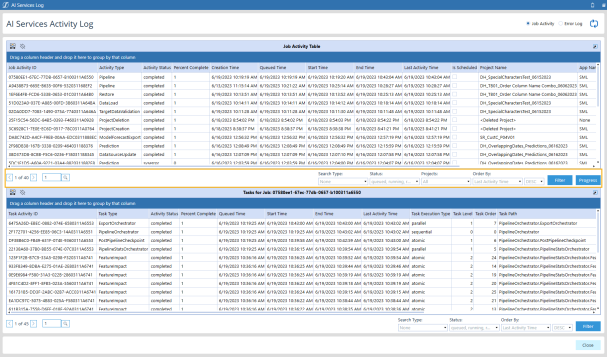
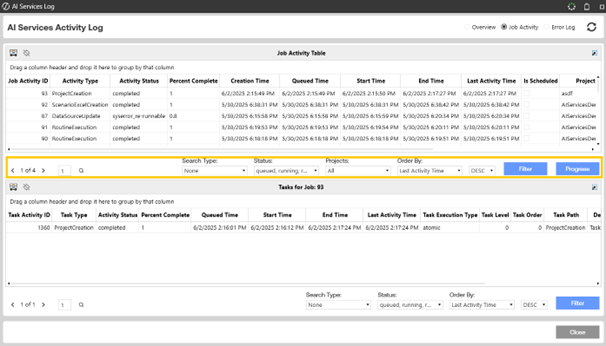
You can order, sort, and filter records for all views. To filter the logs, select a search type from the drop-down menu. After selecting a search type, a Search Method and Filter Value display for both jobs and tasks. Edit the Search method if needed and input a filter value. Click Filter once these settings have been selected. Select a job and click Progress to see the selected job's progress in the Job Progress dialog box, which shows the job's current activity status.
SensibleAI Forecast tracks all jobs and each job's tasks. Use the Job Activity Table in the
AI Services Activity log to see general job traffic and job details, completion status, queue order of jobs set to run immediately or on a schedule, and other job and task details.
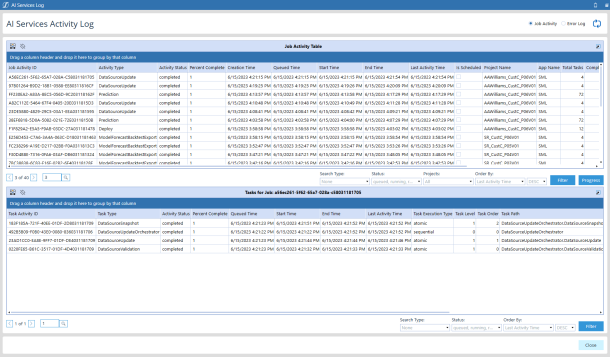
The Job Activity page has a Job Activity Table pane and a Tasks pane. Both panes list activity in the OneStream grid, so items in the grid can be ordered, sorted by any column, and filtered. All items in a grid can be sorted using the sort functionality.
TIP: Use the scroll bars in either pane to see all columns.
Each item in the Job Activity Table represents a job that has run in SensibleAI Forecast. Select a job to see the job's tasks in the Tasks pane. Each job includes the following:
Job Activity ID: Unique ID given to the job when first queued.
Activity Type: Part of the project or page in SensibleAI Forecast where the job was generated.
Activity Status: The current status of the job.
-
queued: Indicates if the job or task is queued to run. If a job is scheduled, it is queued with a QueuedTime when the job is scheduled to run.
-
running: The job or task is currently running.
-
running_subtasks: An orchestrator task is currently running subtasks.
-
completed: The job or task completed successfully.
-
syserror/syscancelled:The job or task failed due to a system failure or the system canceling the job or task.
-
usercancelled: The job or task was cancelled by a user.
-
syserror_re-runnable: The job or task failed due to a data validation error and can be re-run once the issue has been resolved.
-
worker_queued: The task is currently in the queue to be picked up by a worker. This is only an activity status for atomic tasks and not jobs.
Percent Complete: Completion percentage of all the job's tasks.
Creation Time, Queued Time: Time that the job was created and moved to the job execution queue.
Start Time, End Time: Job's start and end dates and times.
Last Activity Time: Time that the most recent job activity completed. When a job successfully completes, this is the same as the End Time.
Is Scheduled: Selected indicates that the job was originally scheduled or scheduled to run at a future date and time.
Project Name: Name given to the project when it was created. <No Project> displays if the job did not execute for a specific SensibleAI Forecast project. <Deleted Project> displays if the job run for a specific SensibleAI Forecast project has been deleted.
App Name: Application responsible for running the job.
Total Tasks, Completed Tasks: Number of tasks run by the job and the number of tasks that ran successfully.
Server Name: The name of the server where the job completed.
Project ID: ID given to the SensibleAI Forecast project when it was created.
Information displayed for tasks include:
Task Activity ID: Unique identifier assigned to the task when it is created.
Activity Status: The current status of the job.
-
queued: Indicates if the job or task is queued to run. If a job is scheduled, it is queued with a QueuedTime when the job is scheduled to run.
-
running: The job or task is currently running.
-
running_subtasks: An orchestrator task is currently running subtasks.
-
completed: The job or task completed successfully.
-
syserror/syscancelled:The job or task failed due to a system failure or the system canceling the job or task.
-
syserror_re-runnable: The job or task failed due to a data validation error and can be re-run once the issue is resolved.
-
data_validation_error: The job or task failed due to a data validation error.
-
worker_queued: The task is currently in the queue to be picked up by a worker. This is only an activity status for atomic tasks and not jobs.
Percent Complete: Completion percentage of all the job's tasks.
Queued Time, Start Time, End Time, Last Activity Time, Percent Complete: These columns have the same type of information as they do for jobs, but these are for a selected job's tasks.
Task Execution Type: Indicates whether the task is synthetic, atomic, sequential, or parallel.
Task Level, Task Order: Order of a job within the displayed task level.
Task Path: The routine within the job where the task runs.
-
Synthetic: A task that runs within an atomic task. It is only included in the AI Services Task Activity log if the task fails.
-
Atomic: One which has a simple, self-contained definition (for example, one that is not described in terms of other workflow tasks) and only one instance of the task runs when it is initiated.
-
Sequential: Tasks are distributed across different processors and run in a specific order.
-
Parallel: Task is distributed with other tasks across different processors and concurrently run by processes.
Process ID: Unique identifier assigned to the process in which the job was run.
Server Name: The name of the server that completed the job.
Parent Task Activity ID: Unique identifier assigned to the task's parent when it is created.
Job Activity ID: Unique identifier assigned to the task's job when it is created.
Review Job Errors
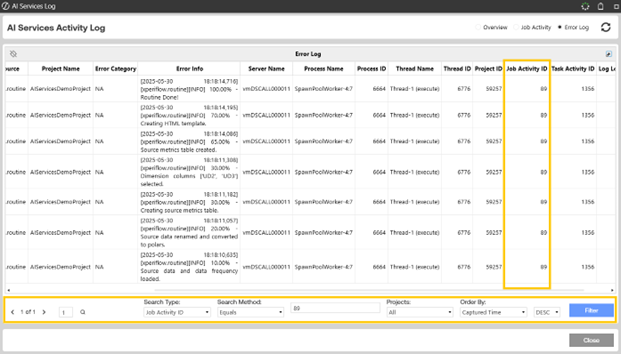
Use the Error Log for information on why a job did not run properly or run to completion, and to aid in error diagnosis and resolution. Types of errors include job execution errors for a specific project, SensibleAI Forecast updates, and login and other connection failures.
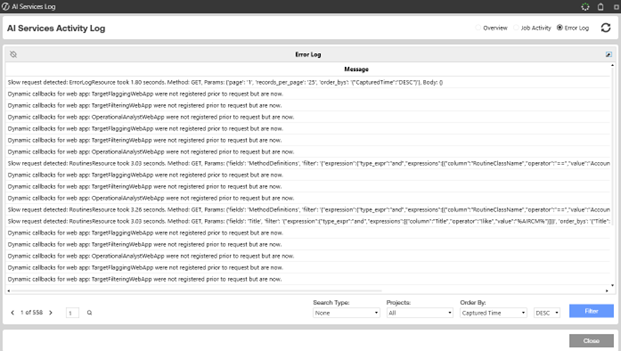
Each entry includes the following information:
Message: Message associated with the error.
Captured Time: The time that the error occurred.
Log Level: Categorizes the severity of the error. Though warnings are logged, they do not necessarily stop a job from running.
Log Source: XperiFlow module where the error occurred.
Project Name: The name of the project that caused the error. <No Project> displays if the error did not occur for a specific SensibleAI Forecast project.
Error Category: General type of error that occurred. NA displays for errors not associated with a specific category.
Error Info: Similar to the information in the Message column, this is detailed information about what occurred to cause the error. For SQL statements that cause an error, this can include details about where in the statement the failure occurred. This information can help technical support with error diagnosis and resolution.
Server Name: The name of the server where the error occurred. Useful when a job is parallelized with multiple servers.
Process Name, Process ID: Unique identifiers that point to the specific process within a server where the error occurred.
Thread Name, Thread ID: Unique identifiers that point to the thread in which the error occurred.
Project ID: Unique identifier given to the project when the project was created. Zeros in this column indicate the error is not associated with a specific project.
Job Activity ID, Task Activity ID: Unique identifiers for the job and task within the job that encountered the error. Zeros in this column indicate the error was not associated with a specific SensibleAI Forecast task or job.
Log Level Number: The number assigned to the type of error. For example, a warning is level 30, an error is level 40.
JSON:
NOTE: Jobs that are not associated with a specific project show zeros for the Job ID, Task ID, and Project ID.
Find Specific Jobs, Tasks, or Errors
The AI Services Log also lets you search for specific jobs, tasks within jobs, and errors. This is useful when you what to find a specific item or items (jobs, tasks, or errors) within a large number of items, or your Job Activity or Error log has multiple pages. Use the search along with table sorting to speed your search of items in the AI Services Activity Log.
Select a search type, then type an ID for the item you want to search for and click Filter. In the Job Activity, you can find Jobs by the Job Activity ID or Project ID to find all jobs in a project. Search by Task Activity ID to find specific tasks.
The Error log lets you find specific errors by Job Activity ID or Task Activity ID, or Project ID. The ID you enter must match the ID exactly, though lowercase letters in the search will match. The following graphic shows the search in the Error Log.
